Hello
It's a Bitcoin Guide.
If you "follow"
You can receive real-time movement paths and comment notifications on major sections.
If my analysis was helpful,
Please click the booster button at the bottom.

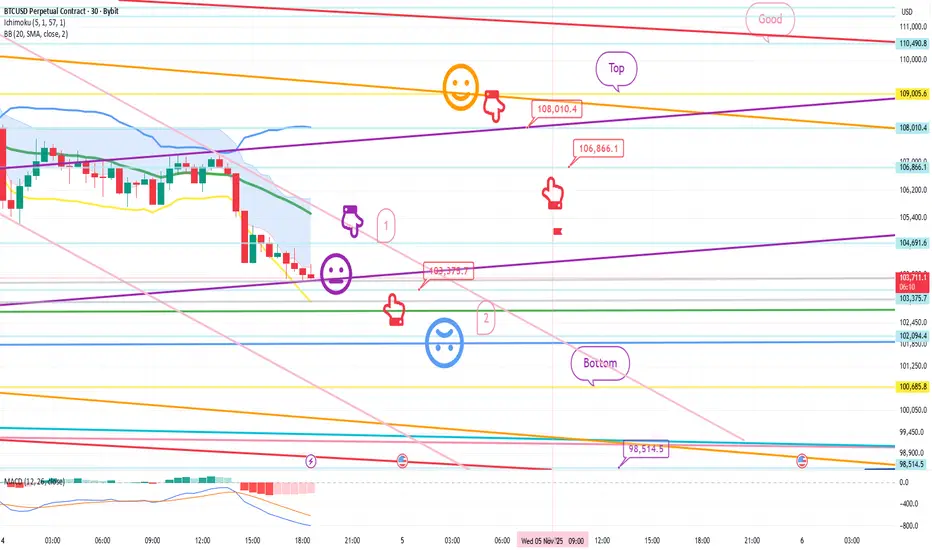
This is the Bitcoin 30-minute chart.
The Nasdaq indicators will be released shortly at noon.
Due to the end of Daylight Savings Time, we need to move back an hour from the previous chart.
Based on the pattern, the weekly chart reached the Bollinger Band support line,
which is a major support line.
However,
there's also pressure from the MACD dead cross on the monthly chart,
and the possibility of a Nasdaq coupling appears high during a decline.
So,
I developed today's strategy centered on the Nasdaq's lower gap retracement.
*When the red finger moves,
this is a conditional long position strategy.
1. Confirm that the purple finger touches the first section (autonomous short).
$103,375.7 long position entry point / stop loss if the light blue support line is broken.
2. $108,010.4 long position primary target -> Target prices are set at Top, then Good in that order. If the strategy is successful, 106.8K will be the point where you can re-enter a long position.
If the price falls immediately without touching the first point at the top, then the second point is the final long position.
The second point is a double bottom based on the low of this uptrend.
Based on the lower tail, the price is open from the bottom to 98.5K.
It would be wise to prepare for a failure of the Nasdaq decline and rebound.
Please use my analysis to this point for reference only.
I hope you operate safely, with a strict trading strategy and stop-loss orders.
Thank you.
It's a Bitcoin Guide.
If you "follow"
You can receive real-time movement paths and comment notifications on major sections.
If my analysis was helpful,
Please click the booster button at the bottom.
This is the Bitcoin 30-minute chart.
The Nasdaq indicators will be released shortly at noon.
Due to the end of Daylight Savings Time, we need to move back an hour from the previous chart.
Based on the pattern, the weekly chart reached the Bollinger Band support line,
which is a major support line.
However,
there's also pressure from the MACD dead cross on the monthly chart,
and the possibility of a Nasdaq coupling appears high during a decline.
So,
I developed today's strategy centered on the Nasdaq's lower gap retracement.
*When the red finger moves,
this is a conditional long position strategy.
1. Confirm that the purple finger touches the first section (autonomous short).
$103,375.7 long position entry point / stop loss if the light blue support line is broken.
2. $108,010.4 long position primary target -> Target prices are set at Top, then Good in that order. If the strategy is successful, 106.8K will be the point where you can re-enter a long position.
If the price falls immediately without touching the first point at the top, then the second point is the final long position.
The second point is a double bottom based on the low of this uptrend.
Based on the lower tail, the price is open from the bottom to 98.5K.
It would be wise to prepare for a failure of the Nasdaq decline and rebound.
Please use my analysis to this point for reference only.
I hope you operate safely, with a strict trading strategy and stop-loss orders.
Thank you.
Trade closed: stop reached
Hello,It's a Bitcoin Guide.
I'll check the movement since the analysis was written on November 4th.
This is the Nasdaq 30-minute chart.
I've marked the key areas with black fingers.
Yesterday, the strategy involved entering a short position at the top with the light blue finger,
and then switching to a long position near Gap 5.
After touching the light blue finger at point 1,
it continued to point 2 -> Gap 5, and then adjusted near the bottom before closing.
Today, a new daily candlestick was created, and the price has fallen to point 3 and is now moving sideways.
Yesterday's movement
repeated the Nasdaq's medium-term pattern,
and the MACD death cross has been imprinted on the daily chart.
This is the Bitcoin 30-minute chart. I've marked the key areas with black fingers.
In the red finger long position strategy,
after entering a short position at the top (purple finger 1st section),
the price reached $103,375.7 at the bottom, and
after breaking through the light blue support line at the second long position switching section,
it was pushed back to the bottom.
The strategy was to cut losses.
The top section (1st section) was the best short entry point,
and a double bottom was expected at the final section (2nd section),
but as expected, it coupled with the Nasdaq,
and fell sharply before rebounding.
I tried to figure out the direction, but the Nasdaq is in chaos again.
As I explained yesterday,
the current position is the major support line on the weekly Bollinger Bands,
and since the weekly candlestick is valid for one week,
it would be good to watch to see how the price moves this week.
From the current breakout, there will be pressure from the MACD dead cross on the monthly chart, so please be careful. Good luck today!
Thank you.
*비트코인가이드 공식텔레그램 Telegram
t.me/BTG_Group
*빙엑스 BingX 50%DC+$5,000 (총1회수수료)
bingx.com/invite/YBM3A4
*바이비트 Bybit 20%DC+$5,020
partner.bybit.com/b/Bitcoin_Guide
*앞으로는 하단의 네이버카페에서만 활동합니다.
cafe.naver.com/loanlife82
t.me/BTG_Group
*빙엑스 BingX 50%DC+$5,000 (총1회수수료)
bingx.com/invite/YBM3A4
*바이비트 Bybit 20%DC+$5,020
partner.bybit.com/b/Bitcoin_Guide
*앞으로는 하단의 네이버카페에서만 활동합니다.
cafe.naver.com/loanlife82
Related publications
Disclaimer
The information and publications are not meant to be, and do not constitute, financial, investment, trading, or other types of advice or recommendations supplied or endorsed by TradingView. Read more in the Terms of Use.