Hello
It's a Bitcoin Guide.
If you "follow"
You can receive real-time movement paths and comment notifications on major sections.
If my analysis was helpful,
Please click the booster button at the bottom.

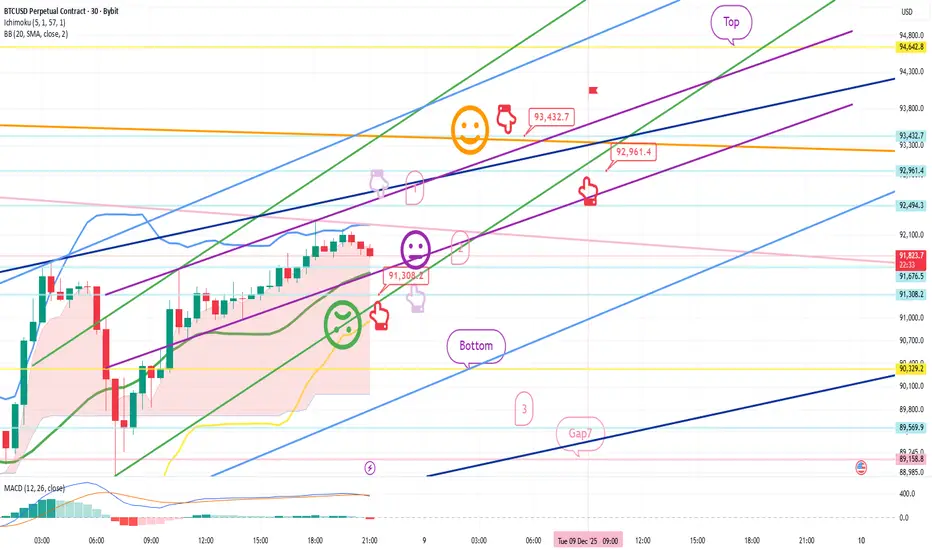
Here's a 30-minute Bitcoin chart.
There are no separate indicators released today.
I've developed a long position strategy based on Nasdaq movements.
*Conditional long position strategy based on the red finger movement path.
- If the price touches the top once or twice and rebounds within the purple support line, it's a vertical rise.
1. If the price falls immediately without touching the top once, the lower level is $91,308.2, the entry point for a long position. / If the green support line is broken, the stop-loss price is $91,308.2.
2. $93,432.7, the first target price for a long position -> the top is the second target price.
If the strategy is successful, $92,961.4 is the point at which to re-enter a long position.
If the price reaches the top before the 9:00 AM candlestick tomorrow, you can enter a short position and then wait for a long position. (Bollinger Band daily chart resistance zone)
The green support line held tight,
but after breaking out, it opened to the bottom, reaching 3 levels.
Please note that my analysis is for reference only.
I hope you will operate safely, with a focus on principled trading and stop-loss orders.
Thank you.
It's a Bitcoin Guide.
If you "follow"
You can receive real-time movement paths and comment notifications on major sections.
If my analysis was helpful,
Please click the booster button at the bottom.
Here's a 30-minute Bitcoin chart.
There are no separate indicators released today.
I've developed a long position strategy based on Nasdaq movements.
*Conditional long position strategy based on the red finger movement path.
- If the price touches the top once or twice and rebounds within the purple support line, it's a vertical rise.
1. If the price falls immediately without touching the top once, the lower level is $91,308.2, the entry point for a long position. / If the green support line is broken, the stop-loss price is $91,308.2.
2. $93,432.7, the first target price for a long position -> the top is the second target price.
If the strategy is successful, $92,961.4 is the point at which to re-enter a long position.
If the price reaches the top before the 9:00 AM candlestick tomorrow, you can enter a short position and then wait for a long position. (Bollinger Band daily chart resistance zone)
The green support line held tight,
but after breaking out, it opened to the bottom, reaching 3 levels.
Please note that my analysis is for reference only.
I hope you will operate safely, with a focus on principled trading and stop-loss orders.
Thank you.
*비트코인가이드 공식텔레그램 Telegram
t.me/BTG_Group
*빙엑스 BingX 50%DC+$5,000 (총1회수수료)
bingx.com/invite/YBM3A4
*바이비트 Bybit 20%DC+$5,020
partner.bybit.com/b/Bitcoin_Guide
*앞으로는 하단의 네이버카페에서만 활동합니다.
cafe.naver.com/loanlife82
t.me/BTG_Group
*빙엑스 BingX 50%DC+$5,000 (총1회수수료)
bingx.com/invite/YBM3A4
*바이비트 Bybit 20%DC+$5,020
partner.bybit.com/b/Bitcoin_Guide
*앞으로는 하단의 네이버카페에서만 활동합니다.
cafe.naver.com/loanlife82
Related publications
Disclaimer
The information and publications are not meant to be, and do not constitute, financial, investment, trading, or other types of advice or recommendations supplied or endorsed by TradingView. Read more in the Terms of Use.