Hello
It's a Bitcoin Guide.
If you "follow"
You can receive real-time movement paths and comment notifications on major sections.
If my analysis was helpful,
Please click the booster button at the bottom.

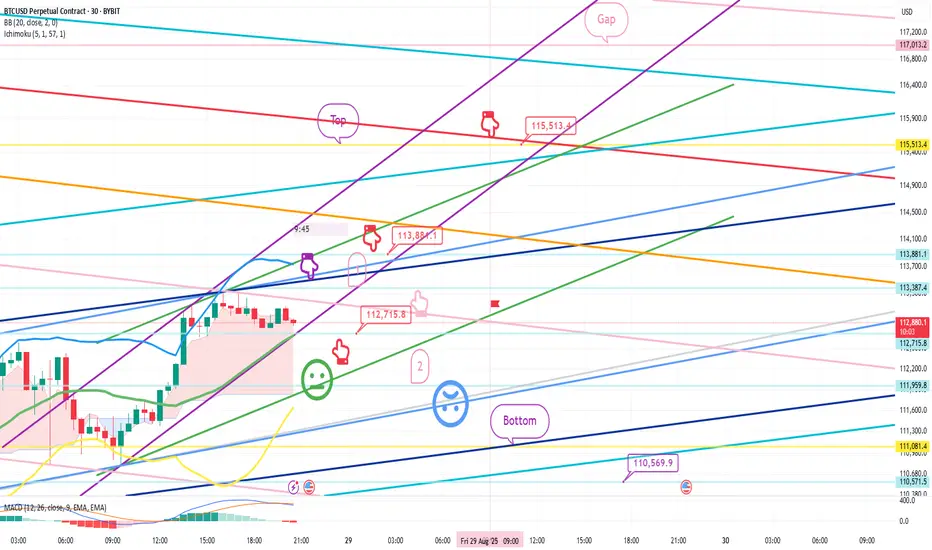
This is a 30-minute Bitcoin chart.
Although not visible on the screen,
I've used the same strategy as the long position entry point two days ago, at $109,950.4.
*If the red finger moves,
this is a conditional long position strategy.
1. After touching the first section at the top, the red finger indicates a long position entry point of $112,715.8. Stop-loss price if the green support line is broken.
(Since the purple finger touches the market, it's likely to immediately connect with an uptrend, so it's best not to open a short position. Check for an upward wave. Also, it's important to check whether the purple support line is broken first.)
2. Long position: $113,881.1. 1st target -> Top. 2nd target -> Target price up to the final gap.
If the price falls immediately without touching the purple finger at the top, hold for the final long position at section 2. Stop-loss price if the light blue support line is broken. Since the light blue support line is a mid-term uptrend line,
it's crucial for long positions not to break out today.
Below that, the bottom is open to $110.5K.
Up to this point, I ask that you use my analysis for reference only.
I hope you operate safely, with a focus on principled trading and stop-loss orders.
Thank you.
It's a Bitcoin Guide.
If you "follow"
You can receive real-time movement paths and comment notifications on major sections.
If my analysis was helpful,
Please click the booster button at the bottom.
This is a 30-minute Bitcoin chart.
Although not visible on the screen,
I've used the same strategy as the long position entry point two days ago, at $109,950.4.
*If the red finger moves,
this is a conditional long position strategy.
1. After touching the first section at the top, the red finger indicates a long position entry point of $112,715.8. Stop-loss price if the green support line is broken.
(Since the purple finger touches the market, it's likely to immediately connect with an uptrend, so it's best not to open a short position. Check for an upward wave. Also, it's important to check whether the purple support line is broken first.)
2. Long position: $113,881.1. 1st target -> Top. 2nd target -> Target price up to the final gap.
If the price falls immediately without touching the purple finger at the top, hold for the final long position at section 2. Stop-loss price if the light blue support line is broken. Since the light blue support line is a mid-term uptrend line,
it's crucial for long positions not to break out today.
Below that, the bottom is open to $110.5K.
Up to this point, I ask that you use my analysis for reference only.
I hope you operate safely, with a focus on principled trading and stop-loss orders.
Thank you.
Trade closed: stop reached
Hello,It's a Bitcoin Guide.
I'll check the movement since writing the analysis on August 28th.
This is a 30-minute chart of the Nasdaq.
I've marked key areas with black fingers.
In the red finger long position strategy,
short at 23,854.9 points in the first area (purple finger at the top)
-> long at 23,550 points (red finger). After switching,
the price continued to touch the good area at the top without breaking away from the purple support line.
After a clean, perfect move,
a strong decline occurred over the weekend, including Friday.
The bottom, marked below, touched 23,321.5 points,
and a rebound is underway.
This move broke the medium-term pattern,
and is putting pressure on the MACD dead cross on the weekly chart.
This is a 30-minute Bitcoin chart.
Key areas are marked with black fingers.
In the red finger long position strategy,
the purple finger at the top represents area 1,
after entering a short position at $113,387.4 (checking the upward wave).
The long position switching area at the bottom is $112,715.8.
A short stop loss was placed after breaking the green support line.
During Friday and the weekend, the price strongly broke from area 2 -> Bottom.
Last week, it fell to $107,803.6, the lower level of the key support area at the mid-term point,
and is now rebounding.
Unfortunately, the strategy was a stop loss.
Last week, area 1 was the best short entry area,
and a drop of around $5,600 occurred. The bottom of the rebound, at $107,803.6, is a major support line consisting of the daily support line and the weekly center line.
If the rebound fails from the current level,
the MACD death cross on the monthly chart may continue to connect,
leading to a medium- to long-term correction and decline.
From a long position perspective,
we need a successful rebound on the Nasdaq and for Bitcoin to hold its own, right?
Because the market is subject to many variables,
we recommend that you always operate safely by trading on principle and maintaining a stop-loss order.
Thank you.
Note
Hello,It's a Bitcoin Guide.
I'll check the movement after writing the analysis on September 1st.
This is a 30-minute chart for the Nasdaq.
Key areas are marked with black fingers.
In the light blue finger short-to-long switching strategy,
it first touched the second long switching area below,
and then closed in a very sideways range.
After a new daily candle was created today,
it broke through the purple support line and is now moving sideways.
There were no significant indicators released yesterday,
so it will be important to see what kind of movement it will show.
This is a 30-minute chart for Bitcoin.
Key areas are marked with black fingers.
In the red finger long position strategy,
the price continued to move sideways until dawn,
after touching the long position entry point at $108,032 at the bottom,
it broke through the first area at the top without breaking the green support line,
and then reached just before the first target price of 110.6K.
The strategy is considered active.
Bitcoin touched a major support line over the weekend
and is in a short-term uptrend.
Today's Nasdaq movement appears to be important.
For those holding long positions,
I hope you manage your trading well with principled trading.
Thank you.
Note
Hello,It's a Bitcoin Guide.
I'll check the movement after writing the analysis on September 2nd.
This is the Nasdaq 30-minute chart.
I've marked the key areas with black fingers.
I didn't post a separate Nasdaq analysis yesterday,
but as I explained in the Bitcoin analysis,
my strategy was to wait for a long position at the bottom area and the daily Bollinger Band support line.
It was a bit of a stretch,
but after breaking the green support line, a strong rebound is underway.
It first touched the Bollinger Band resistance line,
and is in a short-term uptrend, reaching near the gap at the top.
This is the Bitcoin 30-minute chart.
I've marked the key areas with black fingers.
In the lower left corner, the purple finger indicates the area where the long position was entered on September 1st at $108,032.
The red finger indicates a long position.
If the purple finger touches, the strategy is to wait for a long position at $109,491.3, and if the price falls immediately without touching, the strategy is to wait for a long position at $108,767.7 in the second section.
The purple finger touches the rising wave area at the top, and after touching the second section,
the top section is reached.
Both the long position strategy on September 1st and the long position strategy on September 2nd reached their target prices cleanly,
and the strategy was taken profit.
I explained that the first section above the top section could be used as a re-entry point for a long position. However, after rising by about $1,000, the price is now moving sideways.
I wonder if there will be further increases.
I hope everyone operates safely with principled trading.
Thank you.
*비트코인가이드 공식텔레그램 Telegram
t.me/BTG_Group
*빙엑스 BingX 50%DC+$5,000 (총1회수수료)
bingx.com/invite/YBM3A4
*바이비트 Bybit 20%DC+$5,020
partner.bybit.com/b/Bitcoin_Guide
*앞으로는 하단의 네이버카페에서만 활동합니다.
cafe.naver.com/loanlife82
t.me/BTG_Group
*빙엑스 BingX 50%DC+$5,000 (총1회수수료)
bingx.com/invite/YBM3A4
*바이비트 Bybit 20%DC+$5,020
partner.bybit.com/b/Bitcoin_Guide
*앞으로는 하단의 네이버카페에서만 활동합니다.
cafe.naver.com/loanlife82
Related publications
Disclaimer
The information and publications are not meant to be, and do not constitute, financial, investment, trading, or other types of advice or recommendations supplied or endorsed by TradingView. Read more in the Terms of Use.