As of late I’ve been noticing more and more YouTube videos of analysts referencing coinglass heatmaps as a means of understanding where liquidity is.
Coinglass - if you read the details and disclaimer - is a prediction based algorithm and is not true or accurate data.
In fact, exchanges have no enforcement that encourages them to disclose data such as stop loss locations, leverage ratios, or liquidation zones.
To draw your own liquidity heat map, I demonstrate here how you can do that.
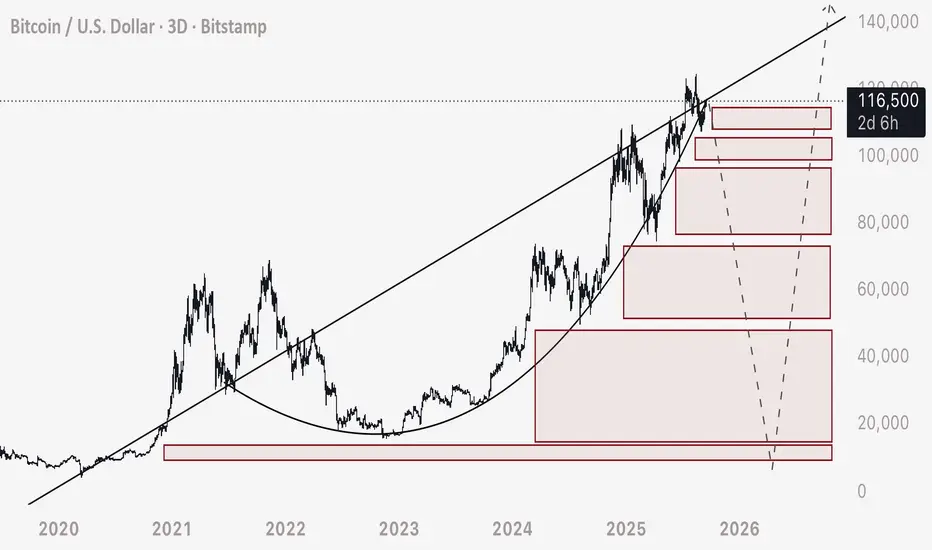
1) Determine the candle sets that move straight up or down - without price reclaiming that area.
2) Draw a box extending out from that section. Respectively these will be buy orders or sell orders.
3) Unlike limit orders for buys and sells, stop losses are extremely important - as they are limit orders that don’t automatically fill if price is at a premium or discount. They only fill if price crosses the exact price, setting off the order.
4) Use your liquidation boxes to determine where these hidden limit orders are in the chart. As we see currently, there is a mass of leveraged sell limit orders (long stop losses) stacked with little to no gaps in between them.
From here, we can understand how Bitcoin moves.
1) The majority of the market cap is leveraging liquidity. Liquidity used by traders leveraging their longs or shorts.
2) These orders leave above (or below) stop loss orders or liquidation prices, that act in the opposite way of traders direction. For example if a trader longs with $100 using 100x, he is leaving underneath his entry a sell order for the entire position size, or $10,000.
3) These stop loss orders trigger a natural chain reaction that fill, one into the next, causing the price to move fluidly as it triggers off the order block areas.
Since Bitcoin has been moving steadily up, sideways, up, sideways - for such a long period, we can deduce that there is a massive chain reaction of sell orders which will allow the price to drop aggressively and fluidly, without any active sell orders being placed by traders.
Traders looking at coinglass or other similar platforms, and stating there is a mass of short liquidity in the chart - are entirely wrong. Zooming out, we can see an overwhelming offset to the long positions left intact in the chart.
The bottom of the price drop will be the end of these stop loss orders. From there, price will leave a quick and quickly start returning to the higher levels.
Hope you found this helpful.
Coinglass - if you read the details and disclaimer - is a prediction based algorithm and is not true or accurate data.
In fact, exchanges have no enforcement that encourages them to disclose data such as stop loss locations, leverage ratios, or liquidation zones.
To draw your own liquidity heat map, I demonstrate here how you can do that.
1) Determine the candle sets that move straight up or down - without price reclaiming that area.
2) Draw a box extending out from that section. Respectively these will be buy orders or sell orders.
3) Unlike limit orders for buys and sells, stop losses are extremely important - as they are limit orders that don’t automatically fill if price is at a premium or discount. They only fill if price crosses the exact price, setting off the order.
4) Use your liquidation boxes to determine where these hidden limit orders are in the chart. As we see currently, there is a mass of leveraged sell limit orders (long stop losses) stacked with little to no gaps in between them.
From here, we can understand how Bitcoin moves.
1) The majority of the market cap is leveraging liquidity. Liquidity used by traders leveraging their longs or shorts.
2) These orders leave above (or below) stop loss orders or liquidation prices, that act in the opposite way of traders direction. For example if a trader longs with $100 using 100x, he is leaving underneath his entry a sell order for the entire position size, or $10,000.
3) These stop loss orders trigger a natural chain reaction that fill, one into the next, causing the price to move fluidly as it triggers off the order block areas.
Since Bitcoin has been moving steadily up, sideways, up, sideways - for such a long period, we can deduce that there is a massive chain reaction of sell orders which will allow the price to drop aggressively and fluidly, without any active sell orders being placed by traders.
Traders looking at coinglass or other similar platforms, and stating there is a mass of short liquidity in the chart - are entirely wrong. Zooming out, we can see an overwhelming offset to the long positions left intact in the chart.
The bottom of the price drop will be the end of these stop loss orders. From there, price will leave a quick and quickly start returning to the higher levels.
Hope you found this helpful.
Related publications
Disclaimer
The information and publications are not meant to be, and do not constitute, financial, investment, trading, or other types of advice or recommendations supplied or endorsed by TradingView. Read more in the Terms of Use.
Related publications
Disclaimer
The information and publications are not meant to be, and do not constitute, financial, investment, trading, or other types of advice or recommendations supplied or endorsed by TradingView. Read more in the Terms of Use.