Pair: BTC/USD
Timeframe: 4H
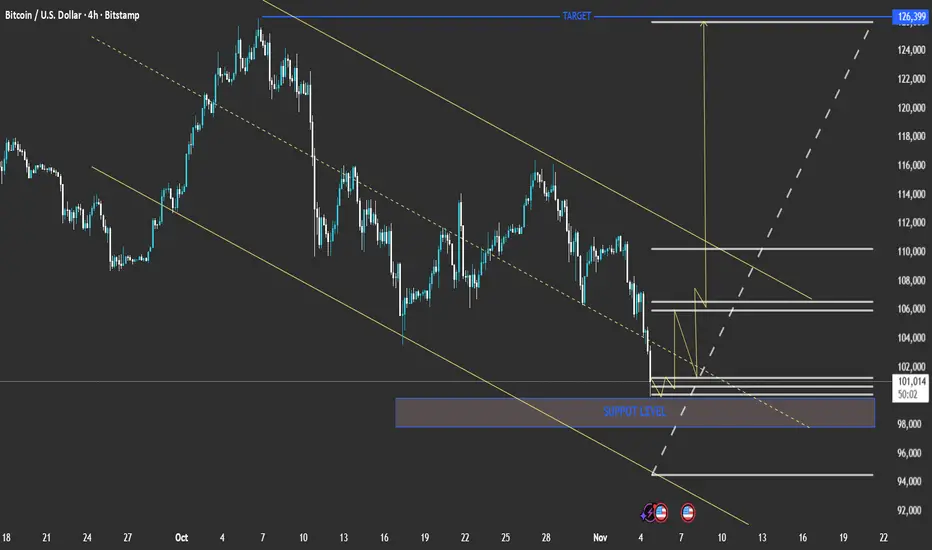
Current Price: ≈ 101,240
Trend: Downtrend within a descending channel
Main Zones:
Support Level: 98,000 – 100,000
Short-Term Resistance: 104,000 – 106,000
Major Target (Upside): 126,399
📉 Technical Outlook
Bitcoin continues to respect the descending channel drawn with parallel trendlines.
The price is now hovering near the lower boundary of the channel, close to the support level zone.
A potential bullish reversal may occur if this support holds, leading to a push toward mid-channel resistance (around 106,000).
📈 Bullish Scenario
If the support at 98,000–100,000 holds:
BTC could rebound toward 104,000 → 106,000 → 110,000.
A confirmed breakout above 110,000 may trigger a strong rally toward the main target of 126,399.
📉 Bearish Scenario
If BTC breaks below 98,000:
Expect further downside to 94,000 – 92,000, the next major demand zone.
This would confirm continuation of the descending channel trend.
⚙️ Summary
Aspect Bias
Trend Bearish (short term)
Key Support 98,000 – 100,000
Key Resistance 106,000 – 110,000
Long-Term Target 126,399 (if breakout occurs)
Short-Term Risk Break below 98,000 BTCUSD
  XLMUSD
  SOLUSD
  ETHUSD
  RPLUSD
  DOGUSD
  LTCUSD
  LNKUSD
  ADAUSD
  EOSUSD EOSUSD
Timeframe: 4H
Current Price: ≈ 101,240
Trend: Downtrend within a descending channel
Main Zones:
Support Level: 98,000 – 100,000
Short-Term Resistance: 104,000 – 106,000
Major Target (Upside): 126,399
📉 Technical Outlook
Bitcoin continues to respect the descending channel drawn with parallel trendlines.
The price is now hovering near the lower boundary of the channel, close to the support level zone.
A potential bullish reversal may occur if this support holds, leading to a push toward mid-channel resistance (around 106,000).
📈 Bullish Scenario
If the support at 98,000–100,000 holds:
BTC could rebound toward 104,000 → 106,000 → 110,000.
A confirmed breakout above 110,000 may trigger a strong rally toward the main target of 126,399.
📉 Bearish Scenario
If BTC breaks below 98,000:
Expect further downside to 94,000 – 92,000, the next major demand zone.
This would confirm continuation of the descending channel trend.
⚙️ Summary
Aspect Bias
Trend Bearish (short term)
Key Support 98,000 – 100,000
Key Resistance 106,000 – 110,000
Long-Term Target 126,399 (if breakout occurs)
Short-Term Risk Break below 98,000
JOIN MY TELEGRAM
t.me/MR_NRACOS_ANALYSIS
t.me/MR_NRACOS_ANALYSIS
SERVICES AVAILABLE FOR CHANNEL
✓FOREX TRADING ANALYSIS
✓FOREX TRADING IDEA 💡
✓FOREX TRADING SIGNALS XAU USD BTC SUD
✓ PREMIUM CHANNEL
t.me/MR_NRACOS_ANALYSIS
t.me/MR_NRACOS_ANALYSIS
SERVICES AVAILABLE FOR CHANNEL
✓FOREX TRADING ANALYSIS
✓FOREX TRADING IDEA 💡
✓FOREX TRADING SIGNALS XAU USD BTC SUD
✓ PREMIUM CHANNEL
Disclaimer
The information and publications are not meant to be, and do not constitute, financial, investment, trading, or other types of advice or recommendations supplied or endorsed by TradingView. Read more in the Terms of Use.