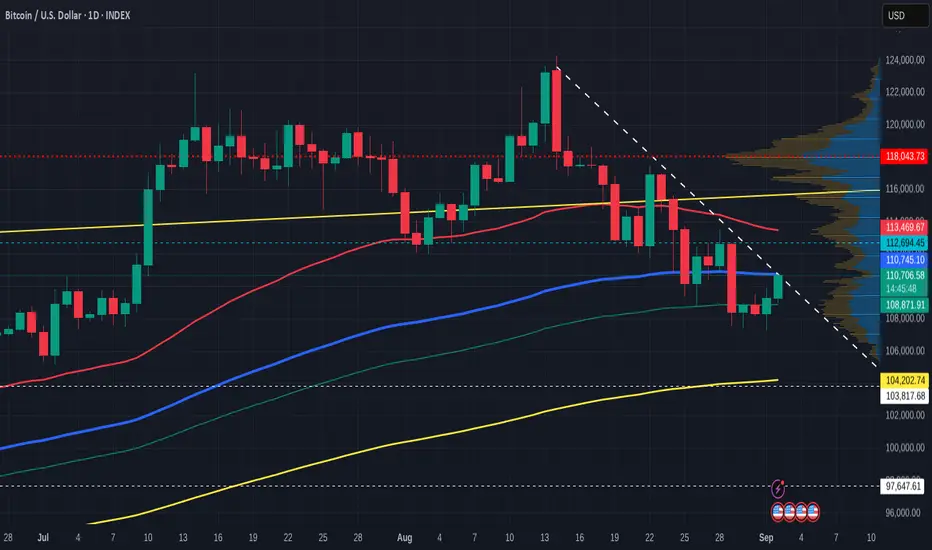
This chart uses the SMA. Red - 50, Blue - 100, Green - 128 and 200 - Yellow
PA is absolutely in a descending channel with repeated Lower Low Lower high on a daily chart
Today, we will see if we break that or not as PA reaches resistance on a Trend line.
The 50 SMA is descending as potential resistance when the day comes were PA breaks out and reaches higher.
This will happen as I do not believe we are entering a Deep Bear..This is a Local "Cool off" but we may hit a tough one at that 50 SMA at around 113K
Till then, we are hitting the 100 as resistance and the 128 as support.
This may break today as we hit that line of resistance with the 128 SMA not far below.
The DAILY MACD offers some hope of strength as we see it bouncing off oversold
We will have to watch today close to see where we go
If we get rejected today, Next stop down could be the 200 SMA at around 103K low
This line needs to hold to show use confidence in the Bulls.
My line of concern will be reached if e go to 95K and fall through.
This daily chart below shows a number of things to support what is written above.
On this , we see the 2.618 Fib extension around the same area as the 200 day SMA @ 103900 usd
The circle highlights a point where a 236 Fib circle crosses over a rising line of support.
This is around 97K and just below this is another line of support around 95K
People that follow me will know that I often highlight 236 Fib circles as lines of strong resistance and on this occasion, this maybe Exactly why we see PA dropping now.
The intersection is near the end of September, a usually slow month that has a majority of RED Candle Closes on a month chart ( 9 red to 5 Green since 2013)
I am not saying we will get to this level but the potential does exist while we remain in a down trend....
I would hope that PA bounces off the Fib extension on that 200 SMA if we get near that 104K line.
On a longer term, we should take note of the WEEKLY MACD
Should this continue down the line drawn, that takes us to Late October before a bounce ur a more sustained push higher.
We should keep this in mind
I welcome any comments ( Sensible ones..)
Trade active
Currently getting rejectedNothing to be taken as Financial advice.
I will always say
"Only invest what you can afford to loose. When you are ready, take out your original investment. This way, it is only your profit that is at risk"
THAT is Financial advice
I will always say
"Only invest what you can afford to loose. When you are ready, take out your original investment. This way, it is only your profit that is at risk"
THAT is Financial advice
Disclaimer
The information and publications are not meant to be, and do not constitute, financial, investment, trading, or other types of advice or recommendations supplied or endorsed by TradingView. Read more in the Terms of Use.
Nothing to be taken as Financial advice.
I will always say
"Only invest what you can afford to loose. When you are ready, take out your original investment. This way, it is only your profit that is at risk"
THAT is Financial advice
I will always say
"Only invest what you can afford to loose. When you are ready, take out your original investment. This way, it is only your profit that is at risk"
THAT is Financial advice
Disclaimer
The information and publications are not meant to be, and do not constitute, financial, investment, trading, or other types of advice or recommendations supplied or endorsed by TradingView. Read more in the Terms of Use.