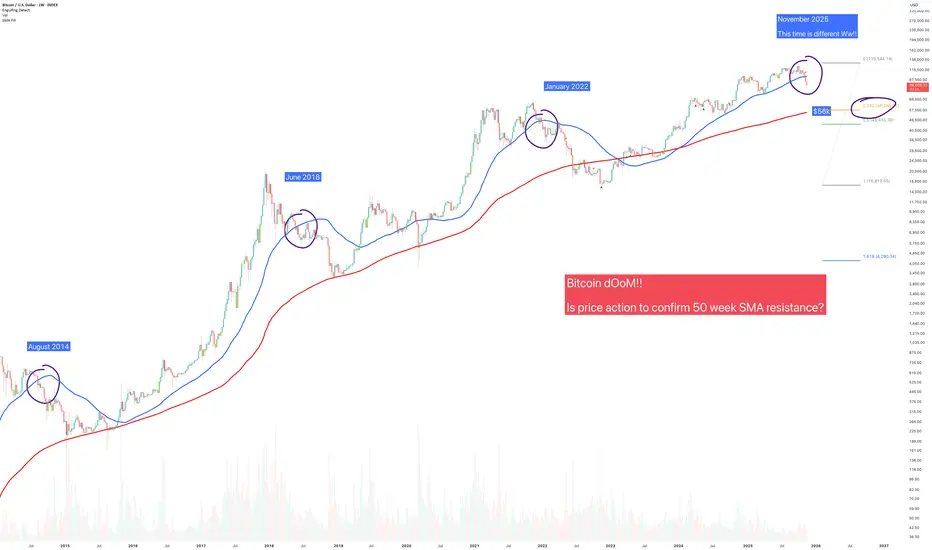
The above chart been brought to my attention by a number of folks asking for an opinion. So here it is.. remember, am just a messenger not target practice.
Price action shown on the above weekly chart has closed under the 50 week SMA, or so I’m told.
“Is that it? The top now in Ww?”
Look left, if you’re using two moving averages:
50 week SMA (blue)
200 week SMA
Then for you, the top is in. It’s over, go home. Congratulate yourself once again for providing exit liquidity for those that entered long positions at $15k. They have your everlasting thanks.
What's the hullabaloo?
Is this time different?
Conclusions
So here we are again, Bitcoin teetering on the edge, influencers chanting “bull market!” like it’s a religion, and yet… there’s that nasty little blue line.
Price action under the 50-week SMA has never ended well. Not once. Every single time, without exception, it’s been followed by a cozy trip down to the 200-week SMA. Historically, that’s what Bitcoin does, it falls until it hits something red and expensive looking, then everyone acts surprised.
And where’s that level today? About $56k. Right on the Fibonacci 0.38. It’s like gravity with maths. But before you light the torches and start the “Ww’s turned bearish” posts, calm down. The candle hasn’t confirmed yet. That’s right, you’ve got until Monday, November 24th to find out if this is the real deal or just another fake-out designed to make you question every life decision since buying at $110k.
Look left. Every time price closed through the 50-week, the same story played out:
August 2014: crash.
June 2018: crash.
January 2022: crash. It’s basically Bitcoin’s version of Groundhog Day, but without Bill Murray or the happy ending.
If it confirms below that line, that’s it. The 200-week SMA becomes the magnet. If not, we’ll bounce, the influencers will return, and everyone will convince themselves they knew all along.
Either way, I’m not saying “doom.” I’m just saying, maths, it works.
Ww
Disclaimer
===============================================================
This isn’t financial advice. Obviously. If you’re taking investment cues from a bloke with a sense of humour about market collapses, you might want to re-evaluate your decision making process.
If you sell here and it pumps that’s on you. If you hold and it dumps, that's also on you. If you blame “market manipulation,” congratulations, you’ve just described every loser in crypto since 2017.
I don’t have a crystal ball, just charts and they don’t lie, even if people do. So whether Bitcoin crashes to $56k, or rallies to $160k, or starts taking payments in “Hopium,” I’ll still be here, tea in hand, smirking, watching the comments fill up with “You were wrong!” from people who were never right. Without Worries (Ww) “Look left, not up.”
Price action shown on the above weekly chart has closed under the 50 week SMA, or so I’m told.
“Is that it? The top now in Ww?”
Look left, if you’re using two moving averages:
50 week SMA (blue)
200 week SMA
Then for you, the top is in. It’s over, go home. Congratulate yourself once again for providing exit liquidity for those that entered long positions at $15k. They have your everlasting thanks.
What's the hullabaloo?
Throughout the history of Bitcoin a test of the 200 weekly SMA occurred every time price action closed under the 50 week SMA. That’s not up for debate, it is a chart fact. Today that would be a highly predictable test of $56k, which is also the Fibonacci 0.38.
This forecast is going to upset a lot of people. The influencers promised them tales for fortune and glory. Instead.. they got a lesson in basic economics, but they had to pay $50,000 for it. You don't get refunds for stupidity, do ya?
Is this time different?
It is not possible to tell right now. Many might look at the chart and quit, they’ve had enough. That would be a mistake. Why? Confirmation.
Look left. Always look left. Until Monday 24th, November it is not known if the break of the 50 week is confirmed. Indeed if you take a closer look, price action has not actually closed a weekly candle body under the 50 week SMA, it has closed through it. That’s important.
Today
January 2022 Confirmation
June 2018 Confirmation
August 2014 Confirmation
Conclusions
So here we are again, Bitcoin teetering on the edge, influencers chanting “bull market!” like it’s a religion, and yet… there’s that nasty little blue line.
Price action under the 50-week SMA has never ended well. Not once. Every single time, without exception, it’s been followed by a cozy trip down to the 200-week SMA. Historically, that’s what Bitcoin does, it falls until it hits something red and expensive looking, then everyone acts surprised.
And where’s that level today? About $56k. Right on the Fibonacci 0.38. It’s like gravity with maths. But before you light the torches and start the “Ww’s turned bearish” posts, calm down. The candle hasn’t confirmed yet. That’s right, you’ve got until Monday, November 24th to find out if this is the real deal or just another fake-out designed to make you question every life decision since buying at $110k.
Look left. Every time price closed through the 50-week, the same story played out:
August 2014: crash.
June 2018: crash.
January 2022: crash. It’s basically Bitcoin’s version of Groundhog Day, but without Bill Murray or the happy ending.
If it confirms below that line, that’s it. The 200-week SMA becomes the magnet. If not, we’ll bounce, the influencers will return, and everyone will convince themselves they knew all along.
Either way, I’m not saying “doom.” I’m just saying, maths, it works.
Ww
Disclaimer
===============================================================
This isn’t financial advice. Obviously. If you’re taking investment cues from a bloke with a sense of humour about market collapses, you might want to re-evaluate your decision making process.
If you sell here and it pumps that’s on you. If you hold and it dumps, that's also on you. If you blame “market manipulation,” congratulations, you’ve just described every loser in crypto since 2017.
I don’t have a crystal ball, just charts and they don’t lie, even if people do. So whether Bitcoin crashes to $56k, or rallies to $160k, or starts taking payments in “Hopium,” I’ll still be here, tea in hand, smirking, watching the comments fill up with “You were wrong!” from people who were never right. Without Worries (Ww) “Look left, not up.”
Note
The S&P 500 currently at 6630, the same price it was in mid-September. Not a crash.At that time Bitcoin was at $118k
-$40k, yes.. that's a crash.
Stock market = 1
Crypto speculation = 0
Disclaimer
The information and publications are not meant to be, and do not constitute, financial, investment, trading, or other types of advice or recommendations supplied or endorsed by TradingView. Read more in the Terms of Use.
Disclaimer
The information and publications are not meant to be, and do not constitute, financial, investment, trading, or other types of advice or recommendations supplied or endorsed by TradingView. Read more in the Terms of Use.