Feeling fearful? Better sell now before the market really tanks? Emotion is a money killer. Fear & Greed index now at 37. Blood is on the streets, it is literally the best moment to buy, into the fear.
alternative.me/crypto/fear-and-greed-index/
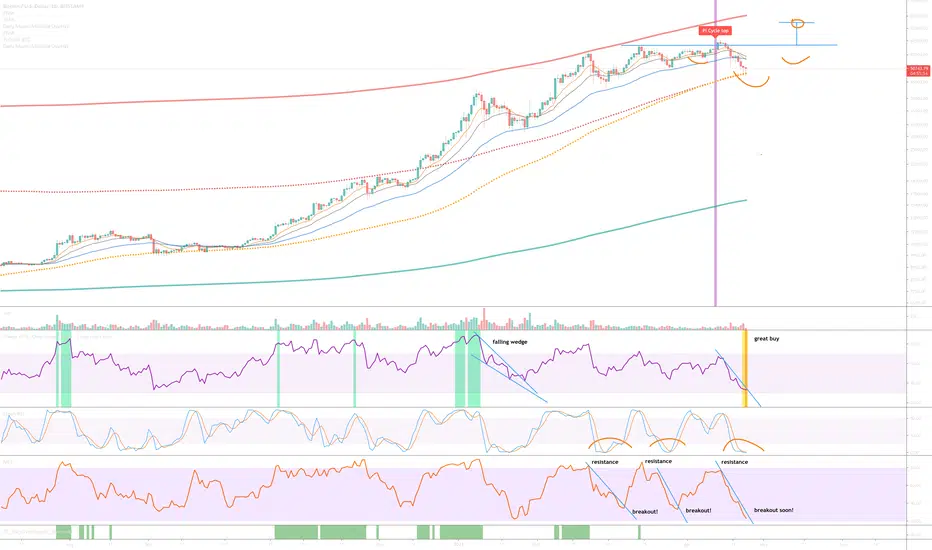
Why bullish? Predominately for three reasons.
1) One of my favourite indicators is telling us a breakout is coming in the days ahead. On the above 1-day chart the Money Flow Index (MFI) is currently showing resistance (bottom oscillator). Resistance is shown by the blue lines. Look left, following a breakout on the previous two occasions price action rallies.
2) Confluence with the MFI is necessary for it to be meaningful. Stochastic RSI was below 20 prior to the MFI breakout previous occasions just as it is now. This is indicated by the orange curves.
3) The weekly chart below shows the 9-year support and resistance trend line. Recently price action broke through and tested as support. Support was confirmed.
Entry price? $45k is amazing if you can get it.

alternative.me/crypto/fear-and-greed-index/
Why bullish? Predominately for three reasons.
1) One of my favourite indicators is telling us a breakout is coming in the days ahead. On the above 1-day chart the Money Flow Index (MFI) is currently showing resistance (bottom oscillator). Resistance is shown by the blue lines. Look left, following a breakout on the previous two occasions price action rallies.
2) Confluence with the MFI is necessary for it to be meaningful. Stochastic RSI was below 20 prior to the MFI breakout previous occasions just as it is now. This is indicated by the orange curves.
3) The weekly chart below shows the 9-year support and resistance trend line. Recently price action broke through and tested as support. Support was confirmed.
Entry price? $45k is amazing if you can get it.
Trade active
Trade active
Doubts over which way Bitcoin is going over the next 10-days? The 10-day chart below printed a new candle on May 1st and makes it very clear what we should expect ;)Note
Short term target, $61400 - that's the one to watch. A break + support confirmation will result the in the $75k occurring rather quickly.Note
Everything continues to look good - just waiting for this pennant to break out. Until then price action will be the most boring thing ever. Be patient.Trade active
Above I put the entry price from $45k. This is an update to that and is now $40 - 42k - amazing if you can get it, ignore the fear. Trade active
BTC price action has produced yet another 'incredible buy' condition. Incredible opportunities for those that can look beyond the current fear now being experienced by the market: alternative.me/crypto/fear-and-greed-index/Always buy into fear.
Trade active
Price action lands on the 50-week EMA.The last time Bitcoin touched the 50-week EMA during a technical bull market was back in May 2013.
Trade active
The importance of looking left is valuable and never better illustrated at the present moment when fear is almost maxed out.Circled in orange is the Stochastic RSI crossing up 20. Compare and contrast what happens to price action each and every time this occurs.
Are you with me?
Now repeat the comparison when RSI is <40 (the thick blue line). Now you see.
We’re not worried because we looked left ;)
Note
Fear & Greed now "Extreme fear - 10", buy when there's blood on the streets.alternative.me/crypto/fear-and-greed-index/
Trade active
A re-test of the $37k seems probable but by no means certain. Next near term target $48k before continued consolidation.Note
Watch how this candle completes at Sunday midnight June 13th. Thus far it is a good indication throughout the week buyers have shown continued support with each sell off. If it prints 'green', sellers are confirmed exhausted.Two further observations:
1) The candle is forming a Dragonfly DOJI
2) Stochastic RSI has begun crossing up (circled in green) following a cross down of the 80 level 150 days ago. The last time Stochastic RSI was this low under 80 without crossing up 20 (bullish), was back in May 2014!
Watch that candle!
Note
That weekly inverse head & shoulders I started this idea on is becoming more clear, just did not expect the head to reach so far down...Note
Price closing above $55k this week opens the target to $75k.Trade active
Disclaimer
The information and publications are not meant to be, and do not constitute, financial, investment, trading, or other types of advice or recommendations supplied or endorsed by TradingView. Read more in the Terms of Use.
Disclaimer
The information and publications are not meant to be, and do not constitute, financial, investment, trading, or other types of advice or recommendations supplied or endorsed by TradingView. Read more in the Terms of Use.