Were you still fantasy dreamed about super-duper hyped Crypto and Tech names, or recently were wiped out already when prices changed each second on Friday, October 10, 2025 even faster rather then video clips do it in TikTok Reels or for example YouTube Shorts?..
...but there're several important issues that you should know.
Well.. lets talk about Bitcoin Network Activity Index, and why this one is guide dog that helps you to alive, not staying blind in the Galaxy of uncertainity.
Green Light. Red Light. Both Colours Blind.
Guide dogs (colloquially known in the US as seeing-eye dogs) are assistance dogs trained to lead people who are blind or visually impaired around obstacles. Although dogs can be trained to navigate various obstacles, they are fully red–green colour blind and incapable of interpreting street signs. The human does the directing, based on skills acquired through previous mobility training.
The handler might be likened to an aircraft's navigator, who must know how to get from one place to another, and the dog is the pilot, who gets them there safely.
Understanding Network Activity Index.
While time to time crypto candles change colours on your monitors even faster rather then video clips do it in TikTok Reels or for example YouTube Shorts, there should be a comprehensive metric designed to measure the overall safety and health of the Bitcoin network.
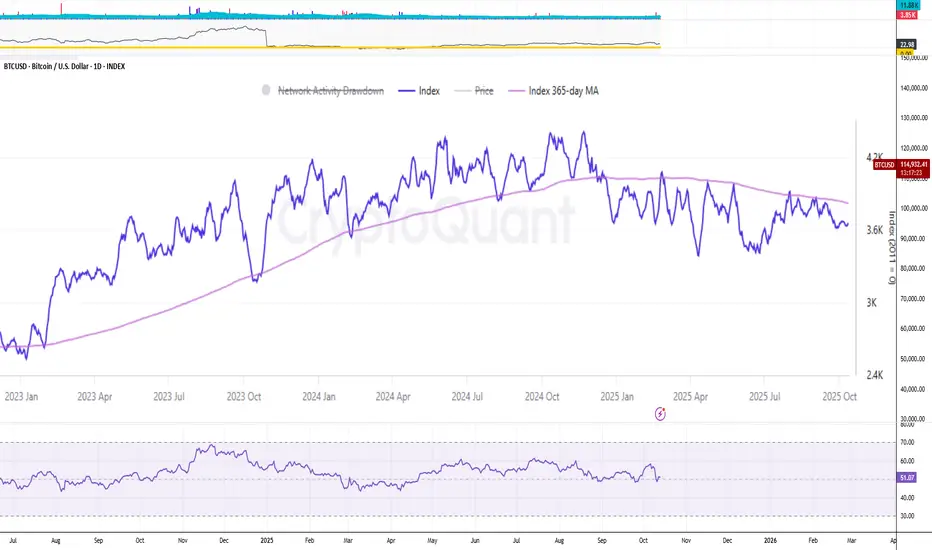
That is Bitcoin Network Activity Index specially designed by CryptoQuant by aggregating several important blockchain indicators.
These indicators include the number of active addresses (sending, receiving and both together), transaction counts, unspent transaction outputs (UTxOs), average block size, and other on-chain transactional data. This index provides a quantifiable overview of how much usage and engagement the Bitcoin blockchain is experiencing at any given time.
Bictoin Network Activity Index. How it works
The index serves as an important tool for understanding the fundamental dynamics of Bitcoin beyond just price movements. It captures the transactional activity and network participation that underpin Bitcoin’s value as a decentralized digital asset. For example, increases in the Network Activity Index often coincide with periods of rising Bitcoin price and heightened market enthusiasm, while decreases can indicate slowing demand, bearish sentiment, or periods of consolidation where market participants are holding rather than actively trading.
Significantly, the CryptoQuant Network Activity Index has been shown to correlate historically with Bitcoin's price action. When transaction volume, active addresses, and other network engagement measures rise, it can signal growing adoption and usage, which creates natural buying pressure and supports price increases. Conversely, sharp declines in network activity have often preceded or occurred alongside Bitcoin price drops, reflecting waning market interest or corrections.
Relations with Bictoin price action.
An example of network activity importance is the noted 600,000 daily transactions threshold highlighted by CryptoQuant analysts. This activity level appears to act as a “price engine” trigger, where surpassing it tends to lead to continued price rallies. Thus, rising transaction counts robustly indicate rising underlying demand on the network, which is a bullish sign for Bitcoin’s price.
However, it is important to note that network activity by itself does not determine price direction in isolation. Bitcoin’s price is influenced by a mix of factors including macroeconomic conditions, regulatory developments, market speculation and institutional activiry.
And yet, network activity remains a key fundamental indicator that helps market participants gauge the genuine level of usage and interest in Bitcoin, providing insights about market sentiment and potential price trends.
Conclusion.
In summary, the Bitcoin Network Activity Index is crucial because it quantifies Bitcoin’s on-chain operational health and user engagement, which are leading indicators of the asset’s intrinsic demand and valuation. Monitoring this index allows investors, analysts, and traders to make more informed predictions about Bitcoin’s future price action by understanding shifts in real network usage and investor behavior rather than relying solely on price charts or external market narratives.
Were you happy about it or not, but Bitcoin Network Activity Index still sits shy under its 52-week SMA, all the year 2025, while average number of active BTC addresses recently reached 52-week lows (compare with BTC price, that is still far above its 52-weeks lows).
--
Best 'be careful in the night' wishes,
PandorraResearch Team

...but there're several important issues that you should know.
Well.. lets talk about Bitcoin Network Activity Index, and why this one is guide dog that helps you to alive, not staying blind in the Galaxy of uncertainity.
Green Light. Red Light. Both Colours Blind.
Guide dogs (colloquially known in the US as seeing-eye dogs) are assistance dogs trained to lead people who are blind or visually impaired around obstacles. Although dogs can be trained to navigate various obstacles, they are fully red–green colour blind and incapable of interpreting street signs. The human does the directing, based on skills acquired through previous mobility training.
The handler might be likened to an aircraft's navigator, who must know how to get from one place to another, and the dog is the pilot, who gets them there safely.
Understanding Network Activity Index.
While time to time crypto candles change colours on your monitors even faster rather then video clips do it in TikTok Reels or for example YouTube Shorts, there should be a comprehensive metric designed to measure the overall safety and health of the Bitcoin network.
That is Bitcoin Network Activity Index specially designed by CryptoQuant by aggregating several important blockchain indicators.
These indicators include the number of active addresses (sending, receiving and both together), transaction counts, unspent transaction outputs (UTxOs), average block size, and other on-chain transactional data. This index provides a quantifiable overview of how much usage and engagement the Bitcoin blockchain is experiencing at any given time.
Bictoin Network Activity Index. How it works
The index serves as an important tool for understanding the fundamental dynamics of Bitcoin beyond just price movements. It captures the transactional activity and network participation that underpin Bitcoin’s value as a decentralized digital asset. For example, increases in the Network Activity Index often coincide with periods of rising Bitcoin price and heightened market enthusiasm, while decreases can indicate slowing demand, bearish sentiment, or periods of consolidation where market participants are holding rather than actively trading.
Significantly, the CryptoQuant Network Activity Index has been shown to correlate historically with Bitcoin's price action. When transaction volume, active addresses, and other network engagement measures rise, it can signal growing adoption and usage, which creates natural buying pressure and supports price increases. Conversely, sharp declines in network activity have often preceded or occurred alongside Bitcoin price drops, reflecting waning market interest or corrections.
Relations with Bictoin price action.
An example of network activity importance is the noted 600,000 daily transactions threshold highlighted by CryptoQuant analysts. This activity level appears to act as a “price engine” trigger, where surpassing it tends to lead to continued price rallies. Thus, rising transaction counts robustly indicate rising underlying demand on the network, which is a bullish sign for Bitcoin’s price.
However, it is important to note that network activity by itself does not determine price direction in isolation. Bitcoin’s price is influenced by a mix of factors including macroeconomic conditions, regulatory developments, market speculation and institutional activiry.
And yet, network activity remains a key fundamental indicator that helps market participants gauge the genuine level of usage and interest in Bitcoin, providing insights about market sentiment and potential price trends.
Conclusion.
In summary, the Bitcoin Network Activity Index is crucial because it quantifies Bitcoin’s on-chain operational health and user engagement, which are leading indicators of the asset’s intrinsic demand and valuation. Monitoring this index allows investors, analysts, and traders to make more informed predictions about Bitcoin’s future price action by understanding shifts in real network usage and investor behavior rather than relying solely on price charts or external market narratives.
Were you happy about it or not, but Bitcoin Network Activity Index still sits shy under its 52-week SMA, all the year 2025, while average number of active BTC addresses recently reached 52-week lows (compare with BTC price, that is still far above its 52-weeks lows).
--
Best 'be careful in the night' wishes,
PandorraResearch Team
Disclaimer
The information and publications are not meant to be, and do not constitute, financial, investment, trading, or other types of advice or recommendations supplied or endorsed by TradingView. Read more in the Terms of Use.
Disclaimer
The information and publications are not meant to be, and do not constitute, financial, investment, trading, or other types of advice or recommendations supplied or endorsed by TradingView. Read more in the Terms of Use.