Why Bitcoin Might Have Reached Its Four-Year Cycle Top
Elliott Wave Count Analysis
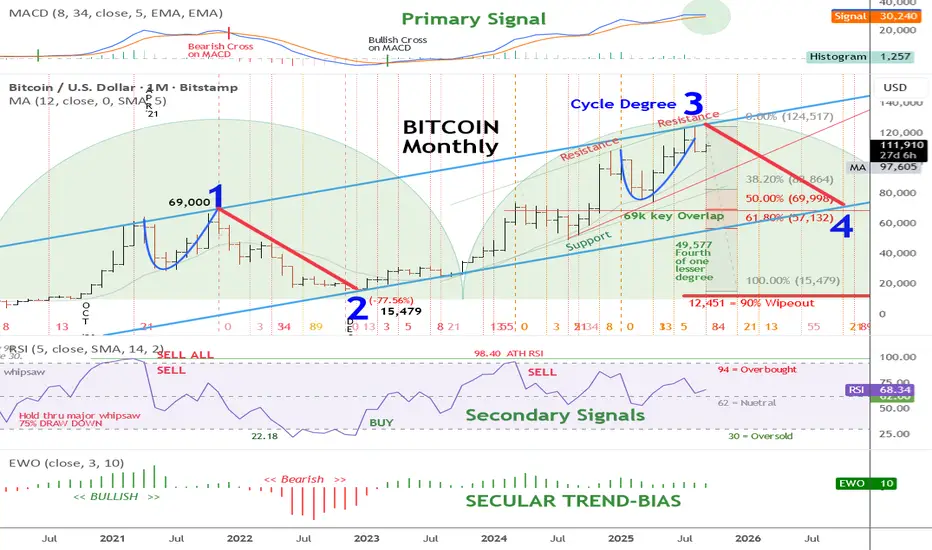
Bullish Posture and Key Levels
- Historical Pattern: Bitcoin's four-year cycle often peaks around halving events, influencing supply and price dynamics.
- MACD Signal: The primary signal indicator in the upper panel remains in a bullish position, with no bearish cross, indicating ongoing upward momentum.
- Wave 3 Peak: The current print high of 125,417 USD marks the crest of Cycle Degree 3, the strongest wave in an impulse sequence.
Elliott Wave Count Analysis
- Current Position: The chart labels the all-time print high of the Cycle Degree 3 high at 125,417.
- Wave 4 Expectation: A corrective wave 4 decline is anticipated, but it must remain above the wave one high of 69,000 USD to uphold the Elliott Wave structure.
- Wave 5 Potential: If wave 4 holds above 69,000 USD, a subsequent wave 5 could drive prices far higher, completing a larger Super Cycle degree wave I.
Bullish Posture and Key Levels
- Primary Signal Indicator: The long-term bullish posture based on the MACD remains intact, with the indicator staying bullish until a monthly close shows the fast-moving average crossing and closing below the slow-moving average.
- Support Level: Maintaining above 69,000 USD during any wave 4 pullback is crucial for the long-term bullish posture to persist and conform with the current wave count analysis.
Disclaimer
The information and publications are not meant to be, and do not constitute, financial, investment, trading, or other types of advice or recommendations supplied or endorsed by TradingView. Read more in the Terms of Use.
Disclaimer
The information and publications are not meant to be, and do not constitute, financial, investment, trading, or other types of advice or recommendations supplied or endorsed by TradingView. Read more in the Terms of Use.