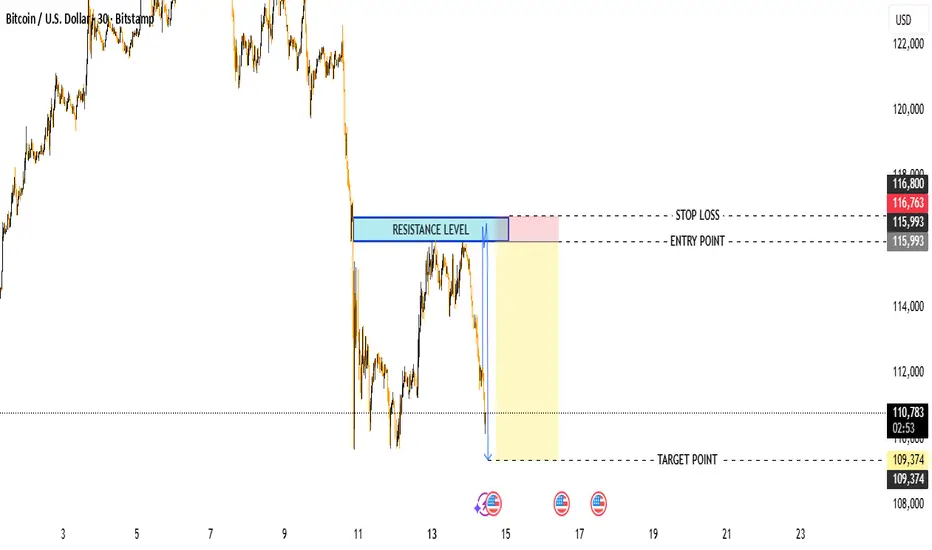
Chart Overview
Pair: Bitcoin / U.S. Dollar (BTC/USD)
Timeframe: 30 minutes
Current Price: ≈ 110,706 USD
Resistance Zone: 115,993 – 116,800 USD
Target Point: 109,374 USD
Stop Loss: 116,800 USD
Bias: Bearish
📊 Technical Outlook
Resistance Level:
The highlighted blue zone marks a strong resistance area where BTC has previously rejected multiple times, showing that sellers are active around 116K.
Price Action:
After testing the resistance zone, the price dropped sharply — confirming bearish momentum.
This suggests that the market may continue its downward move as long as it stays below 116,000 USD.
Entry and Target:
Entry Point: around 115,993 USD after a minor pullback or retest.
Target: 109,374 USD, aligning with prior support and measured move projections.
Stop Loss: 116,800 USD to protect against breakout above resistance.
⚖️ Risk/Reward Ratio
Approx. 1 : 3, which is favorable — meaning for every $1 of risk, the potential reward is about $3.
🧠 Summary
Parameter Level (USD) Interpretation
Entry 115,993 Ideal short entry after retest
Stop Loss 116,800 Above resistance zone
Target 109,374 Previous support / projected target
Bias Bearish Sell the rallies below 116K
⚠️ Notes
Watch for bearish confirmation candles (e.g., engulfing or rejection wicks) near resistance before entering.
A break and close above 116,800 will invalidate the short setup.
Momentum favors sellers while below 116K.
join my telegram channel t.me/goldmitalteam
t.me/goldmitalteam
t.me/goldmitalteam
Disclaimer
The information and publications are not meant to be, and do not constitute, financial, investment, trading, or other types of advice or recommendations supplied or endorsed by TradingView. Read more in the Terms of Use.