BTC/USD: Final wave before breakout or correction signal?
📊 Monthly Technical Analysis — Bitcoin (BTC/USD)
Using support/resistance levels and wave analysis
🌀 Wave Context
According to the Elliott Wave Principle model, Bitcoin may be either in the final impulse wave (5) or at the start of an A-B-C corrective structure.
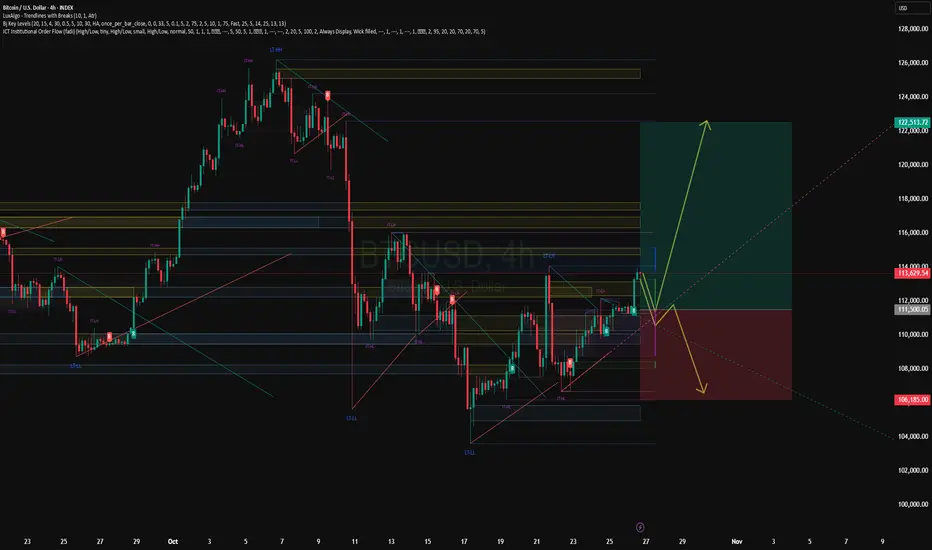
Wave (4) is expected to have ended near the $100,000-$110,000 zone. If wave (5) starts, it could signal a significant upward move. Otherwise, a breakout of support could signal a correction.
📈 Monthly Scenarios
Bullish scenario: BTC holds above $110,000 → breakout to $120,000 → start of wave (5) → move to $135,000+.
Consolidation: The price moves sideways between ~$110,000 and ~$120,000, accumulating strength before a new move.
Bearish scenario: Breakout of support at ~$110,000 with volume → correction to ~$100,000 or lower.
✅Conclusion
On the monthly timeframe, BTC/USD is at a crossroads: it is either entering a powerful uptrend or a significant correction is beginning.
The ~$110,000 level is a key marker for the continuation of the bullish structure.
A breakout above $120,000 is a signal for growth.
A breakout below $110,000 is a signal for caution.
Monitor price movement relative to these levels and confirmation of the wave structure before making trading decisions.
📊 Monthly Technical Analysis — Bitcoin (BTC/USD)
Using support/resistance levels and wave analysis
🌀 Wave Context
According to the Elliott Wave Principle model, Bitcoin may be either in the final impulse wave (5) or at the start of an A-B-C corrective structure.
Wave (4) is expected to have ended near the $100,000-$110,000 zone. If wave (5) starts, it could signal a significant upward move. Otherwise, a breakout of support could signal a correction.
📈 Monthly Scenarios
Bullish scenario: BTC holds above $110,000 → breakout to $120,000 → start of wave (5) → move to $135,000+.
Consolidation: The price moves sideways between ~$110,000 and ~$120,000, accumulating strength before a new move.
Bearish scenario: Breakout of support at ~$110,000 with volume → correction to ~$100,000 or lower.
✅Conclusion
On the monthly timeframe, BTC/USD is at a crossroads: it is either entering a powerful uptrend or a significant correction is beginning.
The ~$110,000 level is a key marker for the continuation of the bullish structure.
A breakout above $120,000 is a signal for growth.
A breakout below $110,000 is a signal for caution.
Monitor price movement relative to these levels and confirmation of the wave structure before making trading decisions.
Related publications
Disclaimer
The information and publications are not meant to be, and do not constitute, financial, investment, trading, or other types of advice or recommendations supplied or endorsed by TradingView. Read more in the Terms of Use.
Related publications
Disclaimer
The information and publications are not meant to be, and do not constitute, financial, investment, trading, or other types of advice or recommendations supplied or endorsed by TradingView. Read more in the Terms of Use.