https://www.tradingview.com/x/QVMAFQWD/
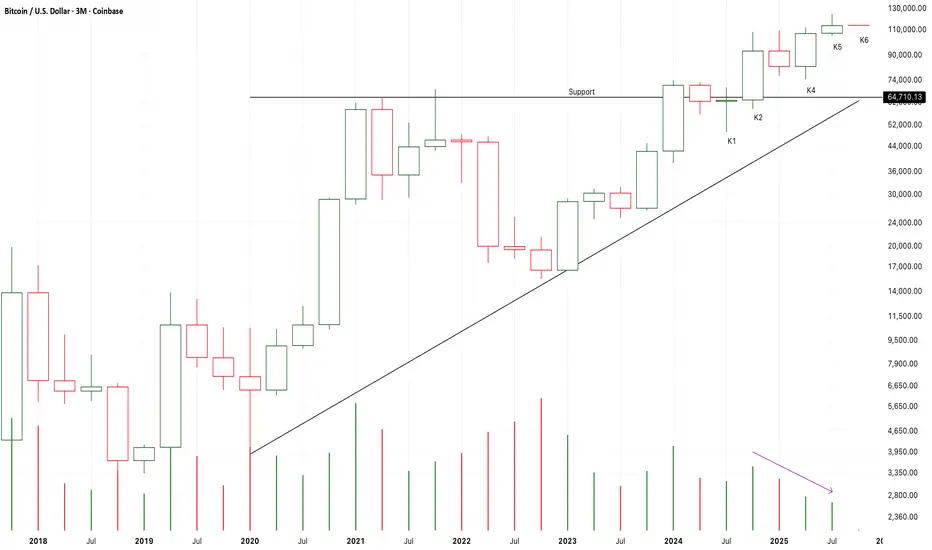
After K2 breaking up a bullish triangle pattern,
The market failed to accelerate to get away from the support line.
From K2 to K6,
There is a trend that both the price and demands keep decreasing to a lowest level.
It verified a weakness of the market.
I am expecting a pull back to retest the support at the following cancels to verify a valid break up of K2.
If K6 is a red candle,
There will be a bearish evening star pattern and the market will most likely fall to test the support.
Note
K2 and K3 is a bearish engulfing pattern,
K4 nearly close below K1.
K4 also close below the long-term uptrend line.
The demands or supply pressure decreasing to a lowest level in a bullish triangle pattern or a potential bearish head-shoulder pattern.
If K5 still close below the uptrend line,
The market will choose to break down,
And, a bear run may start here.
On the other hand,
If K5 close upon K4,
Another bull run may start here.
Trade closed: stop reached
After K2 break up the bullish uptrend triangle pattern,
Another bull run start here.
The market will touch 140K area.
It is not safe to short it anymore.
So, I will cut off at least half of my long positions at MSTZ.
If K3 consolidate around the resistance,
It will be a good place to buy it here.
Disclaimer
The information and publications are not meant to be, and do not constitute, financial, investment, trading, or other types of advice or recommendations supplied or endorsed by TradingView. Read more in the Terms of Use.
Disclaimer
The information and publications are not meant to be, and do not constitute, financial, investment, trading, or other types of advice or recommendations supplied or endorsed by TradingView. Read more in the Terms of Use.