BTC/USDT – Bearish Harmonic Formation | Key Levels & Scenarios
Technical Overview:
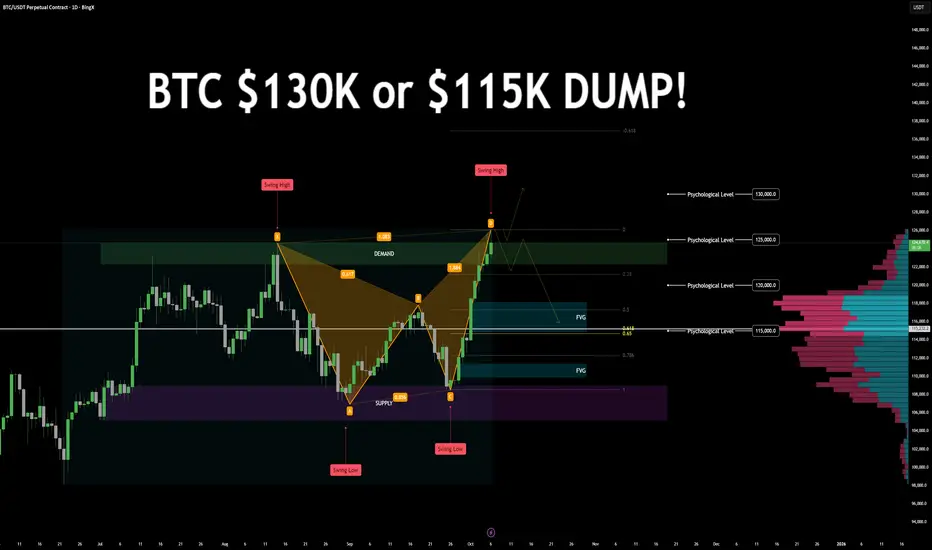
Price is currently forming a bearish harmonic pattern, approaching a key decision zone. The next few daily candles will determine whether BTC continues its bullish trend or initiates a corrective phase.
Key Zones
Demand: 122.2K – 124.7K
Supply: 105.1K – 108.9K
Psychological Levels: 130K · 125K · 120K · 115K
Golden Pocket: Around 115K (0.618–0.65 retracement)
Fair Value Gaps (FVGs):
115K–118K
110K (secondary FVG)
Swing Points:
Previous Swing Low: 108K
Previous Swing High: 126K
High Volume Nodes: 118K and 115K
Market Structure
BTC is respecting a consistent bullish leg with limited pullbacks. Price recently swept the 125K psychological level, aligning with harmonic completion and demand resistance.
Scenario Outlook
🔼 Bullish Continuation:
A daily close above the 124.7K demand zone could invalidate the bearish harmonic and signal continuation toward 130K+ targets.
🔽 Bearish Reversal:
A close below the previous day’s candle low may confirm the start of a bearish correction, targeting 118K → 115K, and potentially 110K.
Bearish Confluences
Bearish Harmonic Pattern completion near key resistance.
Golden Pocket + FVG + Psychological + Volume confluence at 115K.
Extended bullish leg with no significant retracement, followed by 125K liquidity sweep.
LET me know your thoughts below!
Technical Overview:
Price is currently forming a bearish harmonic pattern, approaching a key decision zone. The next few daily candles will determine whether BTC continues its bullish trend or initiates a corrective phase.
Key Zones
Demand: 122.2K – 124.7K
Supply: 105.1K – 108.9K
Psychological Levels: 130K · 125K · 120K · 115K
Golden Pocket: Around 115K (0.618–0.65 retracement)
Fair Value Gaps (FVGs):
115K–118K
110K (secondary FVG)
Swing Points:
Previous Swing Low: 108K
Previous Swing High: 126K
High Volume Nodes: 118K and 115K
Market Structure
BTC is respecting a consistent bullish leg with limited pullbacks. Price recently swept the 125K psychological level, aligning with harmonic completion and demand resistance.
Scenario Outlook
🔼 Bullish Continuation:
A daily close above the 124.7K demand zone could invalidate the bearish harmonic and signal continuation toward 130K+ targets.
🔽 Bearish Reversal:
A close below the previous day’s candle low may confirm the start of a bearish correction, targeting 118K → 115K, and potentially 110K.
Bearish Confluences
Bearish Harmonic Pattern completion near key resistance.
Golden Pocket + FVG + Psychological + Volume confluence at 115K.
Extended bullish leg with no significant retracement, followed by 125K liquidity sweep.
LET me know your thoughts below!
Disclaimer
The information and publications are not meant to be, and do not constitute, financial, investment, trading, or other types of advice or recommendations supplied or endorsed by TradingView. Read more in the Terms of Use.
Disclaimer
The information and publications are not meant to be, and do not constitute, financial, investment, trading, or other types of advice or recommendations supplied or endorsed by TradingView. Read more in the Terms of Use.