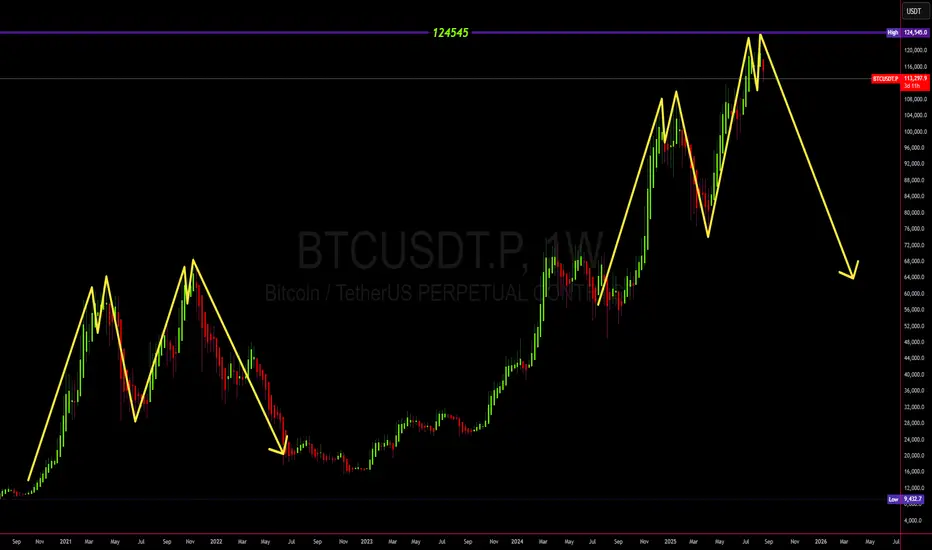
Bitcoin recently hit a new all-time high around $124,500, but the current weekly structure is flashing similarities to the 2021–2022 cycle, when BTC dropped from $69K to $15K (-75%). If history rhymes, a significant correction may be underway.
🔍 Cycle Comparison
2021–2022: 69K → 15K (−75%)
2024–2025: 124.5K → Potential 65–70K (−45%)
Both cycles show strong rallies followed by potential double-top formations, which historically have triggered deeper corrections.
📌 Key Levels
🔼 Resistance: $120K – $124.5K
⚖️ Mid Support: $92K – $85K
🔽 Major Support: $65K – $70K
📈 Bullish Scenario
Condition: Weekly close above 125K
Targets: 135K → 145K
📉 Bearish Scenario (Main)
Condition: Weekly close below 110K
Targets: 92K → 78K → 68K
⚖️ Conclusion
Bitcoin may be entering another historical correction phase, similar to the 2021–2022 cycle. The 65–70K zone remains the strategic support. However, if BTC breaks and holds above 125K, the bearish outlook will be invalidated.
👉 The next few weekly closes will likely decide the bigger trend – patience and risk management are key.
History doesn’t repeat, but it often rhymes — stay prepared for both outcomes.
⚠️ Disclaimer: This is personal analysis only, not financial advice.
#BTC #Bitcoin #Crypto #BTCUSDT #TradingView #CryptoAnalysis
Disclaimer
The information and publications are not meant to be, and do not constitute, financial, investment, trading, or other types of advice or recommendations supplied or endorsed by TradingView. Read more in the Terms of Use.
Disclaimer
The information and publications are not meant to be, and do not constitute, financial, investment, trading, or other types of advice or recommendations supplied or endorsed by TradingView. Read more in the Terms of Use.