Wave Structure Outlook
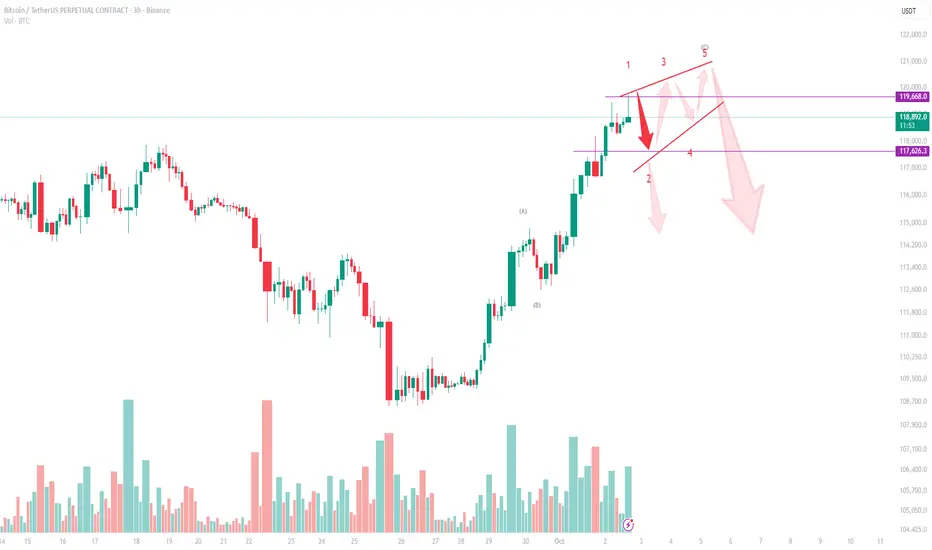
Bitcoin is currently trading near $119,300, where the wave structure suggests a possible Ending Diagonal formation. This leaves us with two bearish scenarios to monitor:
Scenario 1 – Immediate Downside After 1–5 Completion
The 1–5 wave sequence may already be completed.
If so, the market could trigger an immediate downside move, breaking wedge support.
First critical level is $117,600. A clean break below this level would confirm the start of a deeper correction, opening the way toward $115,000 – $113,000.
Scenario 2 – Choppy Ending Diagonal (Light Red Arrows)
Alternatively, BTC may still extend within an Ending Diagonal.
This would mean choppy, back-and-forth price action (small up-and-down moves) before the final breakdown.
In this case, price may retest the $119,800 – $120,000 zone, but the structure remains corrective, and the eventual expectation is still bearish reversal.
Key Levels to Watch
Resistance: $119,800 – $120,000 (upper wedge boundary)
Support: $117,600 (first breakdown level)
Bearish Targets: $115,000 → $113,000
Conclusion
BTC is losing momentum at the end of a 5-wave structure. Whether the market follows Scenario 1 (immediate breakdown) or Scenario 2 (choppy diagonal ending before reversal), the overall outlook is bearish in the short term.
Trade active
💼 Professional market insights & charts:
cakirinsights.com/
cakirinsights.com/
Disclaimer
The information and publications are not meant to be, and do not constitute, financial, investment, trading, or other types of advice or recommendations supplied or endorsed by TradingView. Read more in the Terms of Use.