Hi!
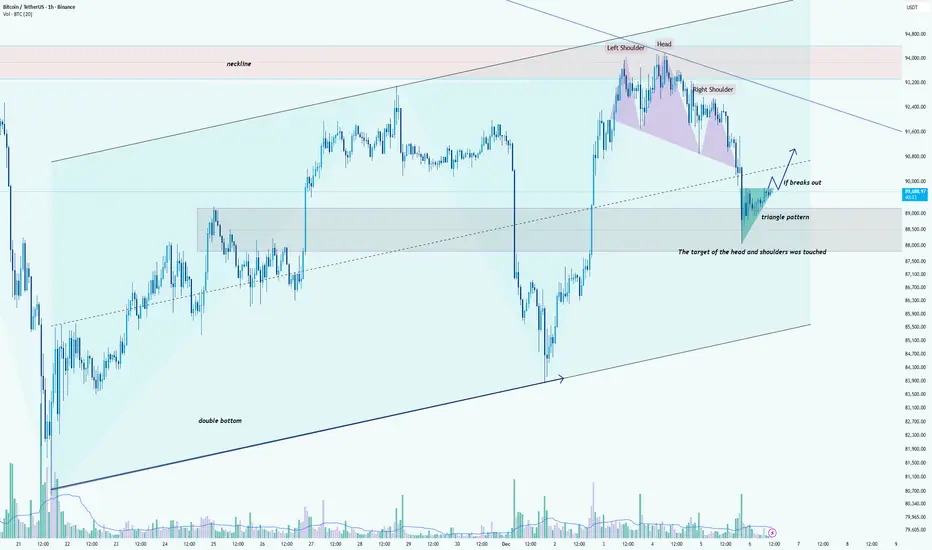
Bitcoin continues to trade within a broader ascending structure, supported by an established rising trendline that has guided price higher over the past weeks. After forming a double bottom near the lower boundary of this channel, BTC initiated a strong rally toward the major resistance zone around 95,000 USDT, where a clear head-and-shoulders reversal pattern appeared. The neckline later broke, and its measured target has already been fully achieved, confirming the pattern’s validity.
Following the completion of this decline, the price stabilized inside the previous consolidation zone and began forming a triangle pattern, signaling compression and potential trend continuation. BTC is now testing the upper boundary of this triangle. A confirmed breakout above the pattern could trigger a bullish continuation toward 90,500–91,200 USDT, aligning with the dashed trendline and short-term resistance levels.
Failure to break upward may lead to a retest of the triangle’s lower boundary or even the broader demand area around 88,000–88,500 USDT, which previously acted as a reaction zone.
Overall, as long as the price remains above the ascending channel’s main support, the medium-term structure favors buyers. A breakout from the triangle will be the key signal for renewed bullish momentum.
Proud ThinkMarkets Ambassador -> Discover & Grow: bit.ly/Think-Markets
------
My recommended Exchange -> YEX: bit.ly/YEX-M
------
Telegram channel: t.me/melikatrader94
Forex channel: t.me/melikatrader94GoldForex
------
My recommended Exchange -> YEX: bit.ly/YEX-M
------
Telegram channel: t.me/melikatrader94
Forex channel: t.me/melikatrader94GoldForex
Related publications
Disclaimer
The information and publications are not meant to be, and do not constitute, financial, investment, trading, or other types of advice or recommendations supplied or endorsed by TradingView. Read more in the Terms of Use.