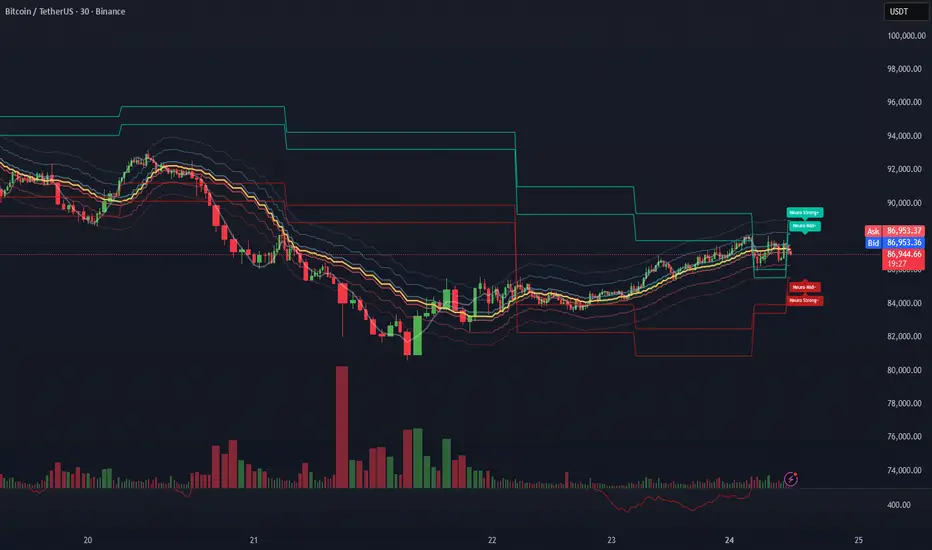
After the sharp selloff, BTC has shifted from a momentum breakdown into a nonlinear stabilization regime inside the NeuroPolynomial Channel (NPC).
Instead of predicting direction, NPC helps quantify where price sits inside its volatility distribution.
1. Current Statistical Position
30m timeframe:
• Trading near NPC Core Cluster
• Distance from lower stress band: ~2.1%
• Distance from upper expansion band: ~1.8%
• Compression factor vs prior leg: ~0.63
This puts price in a statistical mean corridor, not in a trend exhaustion zone.
2. NPC Volatility Zones
Zone Area Distance Role
NPC Strong+ Upper 88,900 – 89,500 +1.8% Over-extension
NPC Upper Band 87,800 – 88,200 +0.8% Continuation band
NPC Core Cluster 86,900 – 87,300 Current Structural equilibrium
NPC Lower Band 85,600 – 86,000 -1.3% Rejection / test
NPC Strong- Lower 84,300 – 84,800 -2.6% Breakdown re-entry
3. Conditional Scenarios (Not Predictions)
Scenario A – Controlled Rebuild (~60%)
If price holds above the core cluster:
→ Rotation zone: 87,800 – 88,200
→ Stretch zone: 88,900 – 89,500
(~+1.8% to +2.3%)
Scenario B – Failed Rebuild (~40%)
If price loses the core cluster:
→ First test: 85,600 – 86,000
→ Risk zone: 84,300 – 84,800
NPC is used here only as a statistical structure lens, not a signal generator.
Let me know if you’re applying this on ETH / SPX / NIFTY — curious how it adapts across markets.
AI-driven market structure analysis.
Disclaimer
The information and publications are not meant to be, and do not constitute, financial, investment, trading, or other types of advice or recommendations supplied or endorsed by TradingView. Read more in the Terms of Use.
AI-driven market structure analysis.
Disclaimer
The information and publications are not meant to be, and do not constitute, financial, investment, trading, or other types of advice or recommendations supplied or endorsed by TradingView. Read more in the Terms of Use.