Trend Analysis
Long-Term Trend:
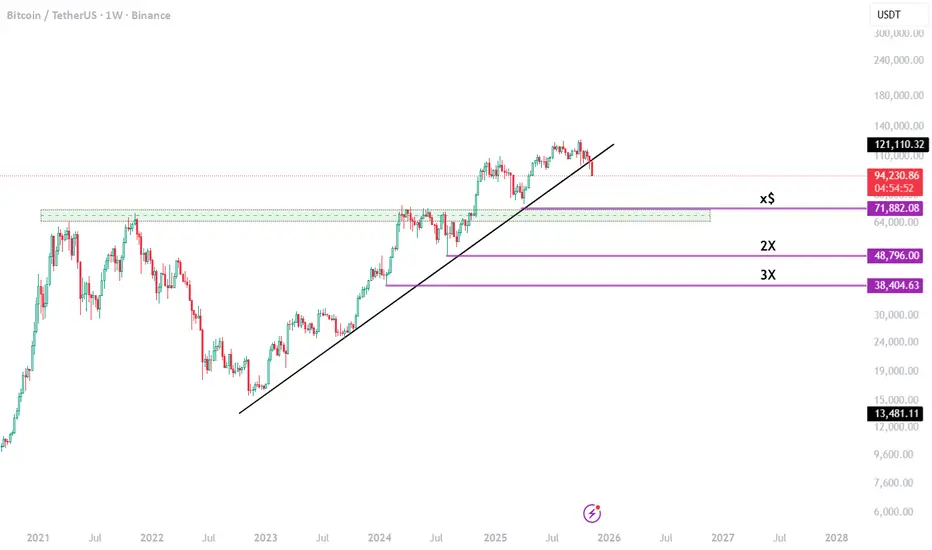
The long-term trend for Bitcoin (BTC/USDT) is still bullish.
This is evident from the overall higher highs and higher lows from mid-2022 to 2025.
The uptrend line (black line) shows strong support, although it has recently been tested.
Short-Term Trend:
On a weekly chart, BTC has recently broken below the ascending trendline.
This indicates a short-term bearish correction.
The latest weekly candle shows a significant drop of almost 10%, confirming short-term selling pressure.
Long-Term Trend:
The long-term trend for Bitcoin (BTC/USDT) is still bullish.
This is evident from the overall higher highs and higher lows from mid-2022 to 2025.
The uptrend line (black line) shows strong support, although it has recently been tested.
Short-Term Trend:
On a weekly chart, BTC has recently broken below the ascending trendline.
This indicates a short-term bearish correction.
The latest weekly candle shows a significant drop of almost 10%, confirming short-term selling pressure.
Disclaimer
The information and publications are not meant to be, and do not constitute, financial, investment, trading, or other types of advice or recommendations supplied or endorsed by TradingView. Read more in the Terms of Use.
Disclaimer
The information and publications are not meant to be, and do not constitute, financial, investment, trading, or other types of advice or recommendations supplied or endorsed by TradingView. Read more in the Terms of Use.