Despite recording a correction of approximately 1% within the past 24 hours with a trading volume of $31.059 Billion, the Bitcoin price has recorded a jump of 11.93% within the past seven days, highlighting a strong bullish rise in the crypto space.
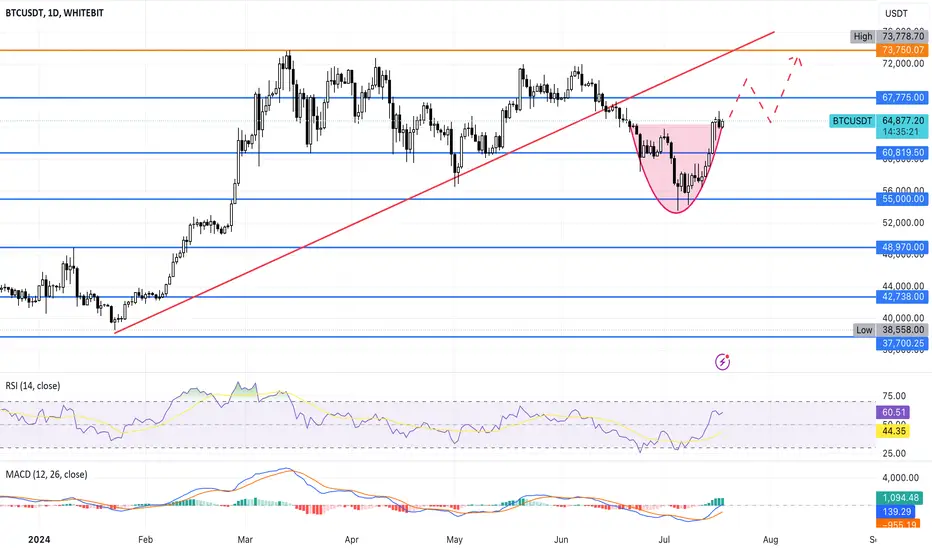
Moreover, the market leader is on the path of testing the resistance neckline of its rounding bottom pattern in the 1D time frame, the outcome of which is unpredictable.
On the other hand, the BTC coin price is also hovering close to its important resistance trendline of the descending channel pattern, highlighting increased price action for the star crypto in the market.
The Moving Average Convergence Divergence (MACD) displays a constant rise in the green histogram with its averages recording a positive action. This indicates increased buying pressure for the BTC token within the crypto space.
The RSI indicator has experienced a neutral action below its overbought range. However, the average trendline displays a bullish action, suggesting a positive outlook this week.
Taking the current market sentiments into consideration, if the bulls continue to gain momentum, Bitcoin price will break out of its crucial resistance level and test its $67,775 mark.
Maintaining the price at that level could result in the star crypto heading toward its high of $73,750.07 during the upcoming weeks.
However, if the bears overpowered the bulls, the BTC price will lose momentum and plunge toward its important support level of $60,000 in the coming time.
Disclaimer
The information and publications are not meant to be, and do not constitute, financial, investment, trading, or other types of advice or recommendations supplied or endorsed by TradingView. Read more in the Terms of Use.
Disclaimer
The information and publications are not meant to be, and do not constitute, financial, investment, trading, or other types of advice or recommendations supplied or endorsed by TradingView. Read more in the Terms of Use.