Breaking New Records: Bitcoin's Path Beyond the August Correction
With Bitcoin currently trading at $114,352 after reaching its all-time high of $124,474 on August 14, 2025, we find ourselves at a critical technical juncture. Ill examine Bitcoin's potential trajectory through the remainder of 2025.
Current Market Context
Bitcoin has climbed from around $85,000 in January to establish a new all-time high of $124,474 in mid-August. Following this peak, we've seen a corrective phase with price action forming a potential bull flag pattern between $112,000-$118,000.
The most recent data shows Bitcoin trading around $114,352, representing a pullback of approximately 8.13% from the all-time high. This moderate retracement suggests a healthy reset rather than a reversal of the primary trend.
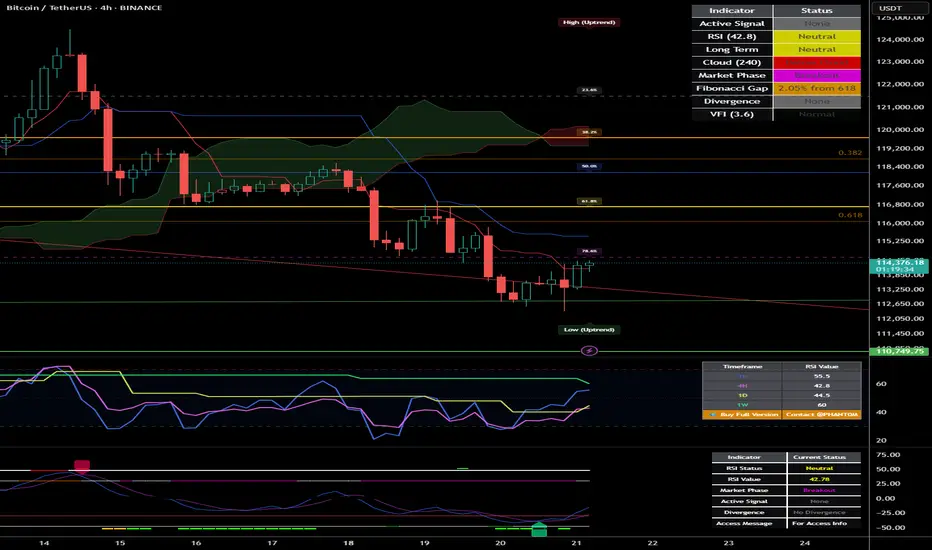
Ichimoku Cloud Analysis
The Ichimoku Cloud indicators provide critical insights:
• Tenkan-sen: $114,127.92
• Kijun-sen: $115,477.50
• Senkou Span A: $119,324.70
• Senkou Span B: $120,176.36
The price is currently trading below the cloud, indicating short-term bearish sentiment. However, the relatively narrow cloud formation ahead suggests potential for a breakout if Bitcoin can reclaim the $119,324-$120,176 range.
Wyckoff Analysis
The price action following the August peak displays characteristics that align with Wyckoff re-accumulation rather than distribution:
• Initial decline represents a "Preliminary Support" phase
• Trading range between $112,000-$118,000 shows decreasing volatility
• Volume characteristics show diminishing selling pressure
• Recent price action suggests we're approaching the "Spring" phase
This structure indicates institutional accumulation is still occurring at these elevated levels, projecting a move toward the $132,000-$145,000 range in the coming months.
Supply/Demand Zone Analysis
Critical price levels that will influence Bitcoin's next directional move:
• Major demand zone: $114,600-$116,700 (Fibonacci 61.8%-78.6% retracement)
• Secondary support: $111,920-$114,000 (recent low and psychological support)
• Primary resistance: $124,474-$127,889 (all-time high region and 127.2% Fibonacci extension)
Moving Average Analysis
The moving average configuration reveals a strong underlying bullish structure:
• 4H EMA 50: $116,284.41
• 4H EMA 100: $116,781.30
• 4H EMA 200: $116,214.57
• Daily EMA 50: $114,939.55
• Daily EMA 100: $110,513.11
• Daily EMA 200: $103,162.36
The hierarchical alignment of these moving averages confirms the primary bull trend remains intact. The current price is finding support near the Daily EMA 50, a critical level that has historically served as a springboard during bull markets.
Fibonacci Extension Framework
Potential targets using Fibonacci extensions from the recent swing points:
• 127.2% extension: $127,889
• 161.8% extension: $132,232
• 200% extension: $137,028
• 261.8% extension: $144,786
Elliott Wave Analysis
The current price action suggests an extended wave structure:
• Wave 1 high (ATH): $124,474
• Wave 2 low (Recent Low): $111,920
• Wave 3 target range: $144,786 to $157,340
• Wave 4 target: $132,231
• Wave 5 target range: $152,545 to $165,100
This wave count suggests potential for continued appreciation toward the $152,000-$165,000 range before a more significant corrective phase begins.
Bitcoin Dominance Factor
Bitcoin's market dominance currently stands at 59.3%, indicating a strong position relative to the broader cryptocurrency market, providing additional support for the bullish case.
Price Projection Timeline
August-September 2025:
Completion of the current consolidation phase with potential final support tests in the $114,600-$116,700 range. A decisive break above $120,000 would confirm the end of the consolidation phase.
October 2025:
Renewed momentum pushing Bitcoin toward the $127,889-$132,232 range, potentially coinciding with seasonal strength typically observed in Q4.
November-December 2025:
Final wave extension potentially reaching the $144,786-$157,340 range, followed by a Wave 4 correction before the final Wave 5 push toward $152,545-$165,100 by year-end or early 2026.
Key Levels to Monitor
Support Zones:
• Primary: $114,600-$116,700 (Fibonacci retracement zone)
• Secondary: $111,920-$114,000 (recent low and psychological support)
• Tertiary: $103,162-$110,513 (Daily EMA 100-200 zone)
Resistance Zones:
• Immediate: $119,324-$120,176 (Ichimoku Cloud base)
• Secondary: $124,474-$127,889 (all-time high region and 127.2% Fibonacci extension)
• Target 1: $132,232-$137,028 (161.8%-200% Fibonacci extensions)
• Target 2: $144,786-$157,340 (Wave 3 target range)
• Target 3: $152,545-$165,100 (Wave 5 target range)
Strategic Considerations
With Bitcoin having already achieved a new all-time high at $124,474 in August, strategic approaches might include:
• Maintaining core positions while implementing trailing stop strategies
• Adding to positions during retests of key support levels ($114,600-$116,700)
• Considering partial profit-taking at key Fibonacci extension levels
• Remaining vigilant for signs of distribution patterns at higher levels
Conclusion: The Path to $165,000
The weight of technical evidence suggests Bitcoin has entered a new paradigm of price discovery. While the path may include periods of consolidation and volatility, the underlying trend remains firmly bullish with multiple technical frameworks projecting targets in the $152,000-$165,000 range by year-end 2025 or early 2026.
The current correction phase represents a healthy reset rather than a trend reversal, creating an ideal technical foundation for Bitcoin's next major advance. Bitcoin appears well-positioned to achieve new record highs in the coming months.
With Bitcoin currently trading at $114,352 after reaching its all-time high of $124,474 on August 14, 2025, we find ourselves at a critical technical juncture. Ill examine Bitcoin's potential trajectory through the remainder of 2025.
Current Market Context
Bitcoin has climbed from around $85,000 in January to establish a new all-time high of $124,474 in mid-August. Following this peak, we've seen a corrective phase with price action forming a potential bull flag pattern between $112,000-$118,000.
The most recent data shows Bitcoin trading around $114,352, representing a pullback of approximately 8.13% from the all-time high. This moderate retracement suggests a healthy reset rather than a reversal of the primary trend.
Ichimoku Cloud Analysis
The Ichimoku Cloud indicators provide critical insights:
• Tenkan-sen: $114,127.92
• Kijun-sen: $115,477.50
• Senkou Span A: $119,324.70
• Senkou Span B: $120,176.36
The price is currently trading below the cloud, indicating short-term bearish sentiment. However, the relatively narrow cloud formation ahead suggests potential for a breakout if Bitcoin can reclaim the $119,324-$120,176 range.
Wyckoff Analysis
The price action following the August peak displays characteristics that align with Wyckoff re-accumulation rather than distribution:
• Initial decline represents a "Preliminary Support" phase
• Trading range between $112,000-$118,000 shows decreasing volatility
• Volume characteristics show diminishing selling pressure
• Recent price action suggests we're approaching the "Spring" phase
This structure indicates institutional accumulation is still occurring at these elevated levels, projecting a move toward the $132,000-$145,000 range in the coming months.
Supply/Demand Zone Analysis
Critical price levels that will influence Bitcoin's next directional move:
• Major demand zone: $114,600-$116,700 (Fibonacci 61.8%-78.6% retracement)
• Secondary support: $111,920-$114,000 (recent low and psychological support)
• Primary resistance: $124,474-$127,889 (all-time high region and 127.2% Fibonacci extension)
Moving Average Analysis
The moving average configuration reveals a strong underlying bullish structure:
• 4H EMA 50: $116,284.41
• 4H EMA 100: $116,781.30
• 4H EMA 200: $116,214.57
• Daily EMA 50: $114,939.55
• Daily EMA 100: $110,513.11
• Daily EMA 200: $103,162.36
The hierarchical alignment of these moving averages confirms the primary bull trend remains intact. The current price is finding support near the Daily EMA 50, a critical level that has historically served as a springboard during bull markets.
Fibonacci Extension Framework
Potential targets using Fibonacci extensions from the recent swing points:
• 127.2% extension: $127,889
• 161.8% extension: $132,232
• 200% extension: $137,028
• 261.8% extension: $144,786
Elliott Wave Analysis
The current price action suggests an extended wave structure:
• Wave 1 high (ATH): $124,474
• Wave 2 low (Recent Low): $111,920
• Wave 3 target range: $144,786 to $157,340
• Wave 4 target: $132,231
• Wave 5 target range: $152,545 to $165,100
This wave count suggests potential for continued appreciation toward the $152,000-$165,000 range before a more significant corrective phase begins.
Bitcoin Dominance Factor
Bitcoin's market dominance currently stands at 59.3%, indicating a strong position relative to the broader cryptocurrency market, providing additional support for the bullish case.
Price Projection Timeline
August-September 2025:
Completion of the current consolidation phase with potential final support tests in the $114,600-$116,700 range. A decisive break above $120,000 would confirm the end of the consolidation phase.
October 2025:
Renewed momentum pushing Bitcoin toward the $127,889-$132,232 range, potentially coinciding with seasonal strength typically observed in Q4.
November-December 2025:
Final wave extension potentially reaching the $144,786-$157,340 range, followed by a Wave 4 correction before the final Wave 5 push toward $152,545-$165,100 by year-end or early 2026.
Key Levels to Monitor
Support Zones:
• Primary: $114,600-$116,700 (Fibonacci retracement zone)
• Secondary: $111,920-$114,000 (recent low and psychological support)
• Tertiary: $103,162-$110,513 (Daily EMA 100-200 zone)
Resistance Zones:
• Immediate: $119,324-$120,176 (Ichimoku Cloud base)
• Secondary: $124,474-$127,889 (all-time high region and 127.2% Fibonacci extension)
• Target 1: $132,232-$137,028 (161.8%-200% Fibonacci extensions)
• Target 2: $144,786-$157,340 (Wave 3 target range)
• Target 3: $152,545-$165,100 (Wave 5 target range)
Strategic Considerations
With Bitcoin having already achieved a new all-time high at $124,474 in August, strategic approaches might include:
• Maintaining core positions while implementing trailing stop strategies
• Adding to positions during retests of key support levels ($114,600-$116,700)
• Considering partial profit-taking at key Fibonacci extension levels
• Remaining vigilant for signs of distribution patterns at higher levels
Conclusion: The Path to $165,000
The weight of technical evidence suggests Bitcoin has entered a new paradigm of price discovery. While the path may include periods of consolidation and volatility, the underlying trend remains firmly bullish with multiple technical frameworks projecting targets in the $152,000-$165,000 range by year-end 2025 or early 2026.
The current correction phase represents a healthy reset rather than a trend reversal, creating an ideal technical foundation for Bitcoin's next major advance. Bitcoin appears well-positioned to achieve new record highs in the coming months.
Discord.gg/CryptoIndicators
Disclaimer
The information and publications are not meant to be, and do not constitute, financial, investment, trading, or other types of advice or recommendations supplied or endorsed by TradingView. Read more in the Terms of Use.
Discord.gg/CryptoIndicators
Disclaimer
The information and publications are not meant to be, and do not constitute, financial, investment, trading, or other types of advice or recommendations supplied or endorsed by TradingView. Read more in the Terms of Use.