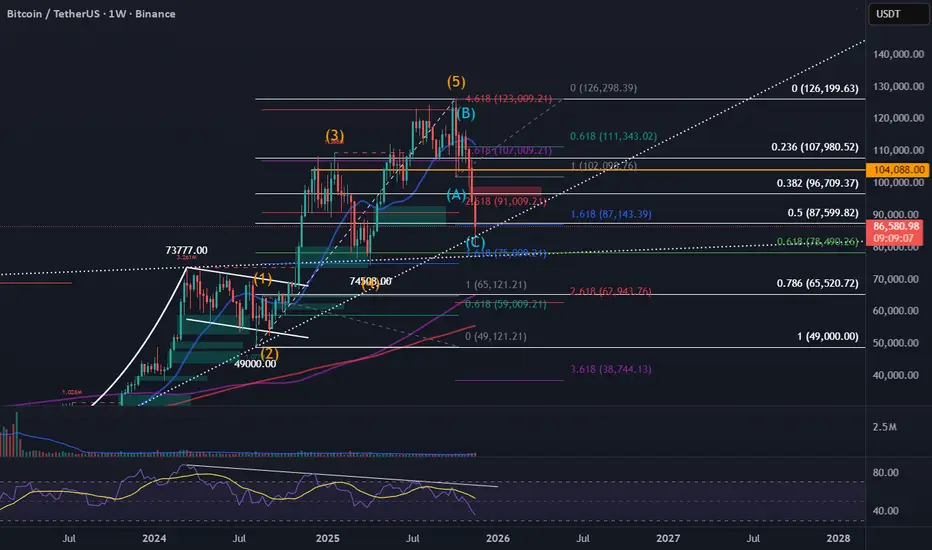
This chart provides a long-term Elliott Wave and Fibonacci confluence analysis for Bitcoin on the weekly timeframe.
After completing a full 5-wave impulsive structure, BTC appears to have entered a corrective ABC pattern, with Wave (C) extending sharply into major support levels. Current price action is testing a powerful cluster of Fibonacci retracements and extensions, including the 1.618, 0.618, and a long-term ascending trendline.
Expection: weekly candle closing above 87,143 and go upwards.
Disclaimer
The information and publications are not meant to be, and do not constitute, financial, investment, trading, or other types of advice or recommendations supplied or endorsed by TradingView. Read more in the Terms of Use.
Disclaimer
The information and publications are not meant to be, and do not constitute, financial, investment, trading, or other types of advice or recommendations supplied or endorsed by TradingView. Read more in the Terms of Use.