Bitcoin has been in a strong corrective phase ever since the October ATH. After breaking down from the rising structure, price has been grinding lower and finally tapped into the broader demand zone we’ve been watching for weeks.
The recent bounce shows that buyers are still active, but the larger trend remains in “recovery mode,” not full reversal mode yet.
🔍 Current Structure
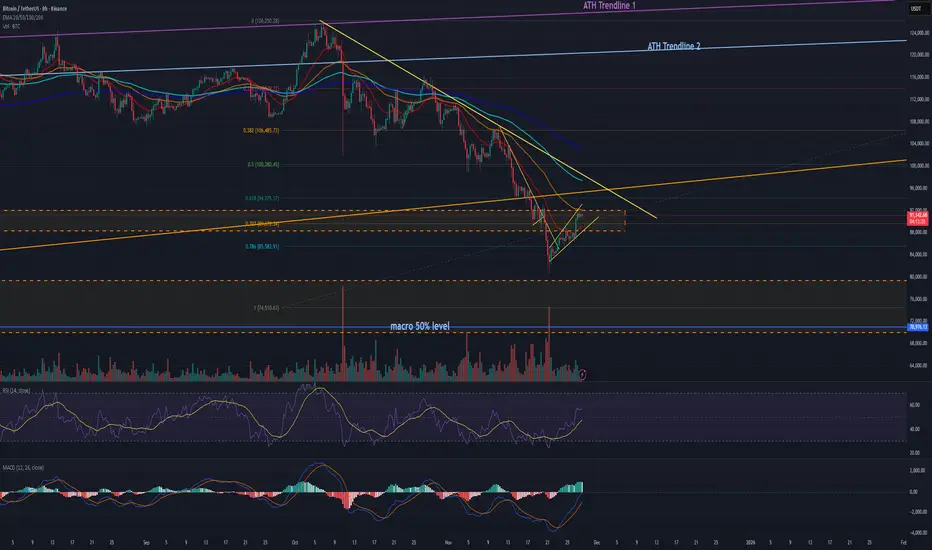
BTC has been trending inside a descending channel since the ATH
Lower highs continue to form under the yellow resistance line
Price found support inside the orange mid-range demand box
RSI and MACD on 8H/12H are recovering, hinting at short-term strength
Volume on the selloff has calmed, suggesting the worst of the panic may be over
Overall, this is a classic cool-down phase after a major breakout — nothing structurally unusual.
📈 Key Levels to Watch
Support:
$87k–$90k — current holding zone
$78k–$80k — major range low if things dip lower
Resistance:
$98k — mid-range ceiling
$102k–$105k — the first meaningful resistance cluster
$113k — upper diagonal rejection area
As long as BTC stays above the mid-range support, the structure remains healthy. Reclaiming the yellow diagonal would open the door toward $102k+ again.
⚡ What’s Next?
Bitcoin is stabilizing after a multi-week correction, but it hasn’t yet broken back into bullish momentum. The next major move will likely depend on whether BTC:
breaks above the descending resistance, or
retests deeper support before reversing higher.
Either way, the macro trend remains intact — this is still a structured pullback within a larger bull cycle.
Not financial advice — just chart analysis.
The recent bounce shows that buyers are still active, but the larger trend remains in “recovery mode,” not full reversal mode yet.
🔍 Current Structure
BTC has been trending inside a descending channel since the ATH
Lower highs continue to form under the yellow resistance line
Price found support inside the orange mid-range demand box
RSI and MACD on 8H/12H are recovering, hinting at short-term strength
Volume on the selloff has calmed, suggesting the worst of the panic may be over
Overall, this is a classic cool-down phase after a major breakout — nothing structurally unusual.
📈 Key Levels to Watch
Support:
$87k–$90k — current holding zone
$78k–$80k — major range low if things dip lower
Resistance:
$98k — mid-range ceiling
$102k–$105k — the first meaningful resistance cluster
$113k — upper diagonal rejection area
As long as BTC stays above the mid-range support, the structure remains healthy. Reclaiming the yellow diagonal would open the door toward $102k+ again.
⚡ What’s Next?
Bitcoin is stabilizing after a multi-week correction, but it hasn’t yet broken back into bullish momentum. The next major move will likely depend on whether BTC:
breaks above the descending resistance, or
retests deeper support before reversing higher.
Either way, the macro trend remains intact — this is still a structured pullback within a larger bull cycle.
Not financial advice — just chart analysis.
Disclaimer
The information and publications are not meant to be, and do not constitute, financial, investment, trading, or other types of advice or recommendations supplied or endorsed by TradingView. Read more in the Terms of Use.
Disclaimer
The information and publications are not meant to be, and do not constitute, financial, investment, trading, or other types of advice or recommendations supplied or endorsed by TradingView. Read more in the Terms of Use.