Smart Money Footprint Visible: Ceat Testing Powerful Demand Zone
Back on 24th July, I shared an idea on Ceat. That call didn’t play out and the Stop Loss (SL) got hit. No surprises there—SLs are simply the cost of doing business in this market. hitting SL is part of trading. The key is discipline – once SL is hit, we must exit without hesitation.
Now, Ceat seems to be offering us another opportunity. Let’s break it down.
📊 Why This Demand Zone Stands Out
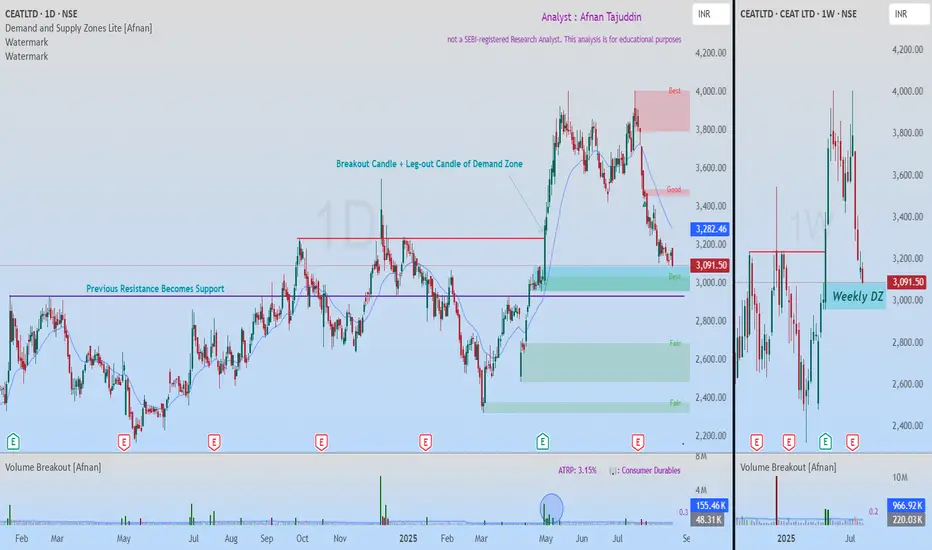
The stock is approaching a very strong demand zone visible clearly on the weekly & Daily timeframe.
📉 Volume Behavior 📉
On the breakout candle, volume was massive. But now, as price is pulling back, we can see volume exhaustion. To me, that signals a lack of real selling pressure. When supply dries up, it leaves the door open for demand to kick back in.
🔎 Confluences Adding Strength 🔎
🎯 Trading Plan 🎯
What I find compelling here is the overlap: weekly demand, daily demand, and a long-tested support line all converging. That kind of alignment doesn’t come around every day. The probability of a bounce looks strong—but at the end of the day, risk management is what separates setups from disasters.
💡 The market will always offer another opportunity—our job is to stay disciplined, manage risk, and be ready when it comes. 🚀📈
⚠️ This analysis is purely for educational purposes only and is not a trading or investment recommendation. I am not a SEBI registered analyst.
Now, Ceat seems to be offering us another opportunity. Let’s break it down.
📊 Why This Demand Zone Stands Out
The stock is approaching a very strong demand zone visible clearly on the weekly & Daily timeframe.
- The leg-out candle that created this demand zone was powerful – it broke past previous resistance with a strong bullish move.
- Follow-through from that breakout candle even took the stock to all-time highs. This tells us it’s not just an ordinary zone but one with institutional footprints.
- Institutions often leave behind pending buy orders in such zones, or they may look to accumulate more here to defend their earlier positions.
- This level first acted as resistance, then flipped into support—a classic price-action rotation.
📉 Volume Behavior 📉
On the breakout candle, volume was massive. But now, as price is pulling back, we can see volume exhaustion. To me, that signals a lack of real selling pressure. When supply dries up, it leaves the door open for demand to kick back in.
🔎 Confluences Adding Strength 🔎
- Weekly demand zone lining up with a daily demand zone.
- Traditional support level overlapping at the same price area.
- Volume analysis confirming lack of strong selling.
🎯 Trading Plan 🎯
- SL should be placed just below the support level to manage risk.
- First target should be the nearest supply zone.
- Till first target, the Risk-to-Reward (RR) ratio is about 1:3, which makes it attractive.
- If SL gets hit, simply exit the trade. No second thoughts.
What I find compelling here is the overlap: weekly demand, daily demand, and a long-tested support line all converging. That kind of alignment doesn’t come around every day. The probability of a bounce looks strong—but at the end of the day, risk management is what separates setups from disasters.
“Trading is not about being right every time. It’s about managing risk smartly and surviving long enough to catch the big moves.”
💡 The market will always offer another opportunity—our job is to stay disciplined, manage risk, and be ready when it comes. 🚀📈
⚠️ This analysis is purely for educational purposes only and is not a trading or investment recommendation. I am not a SEBI registered analyst.
Trade closed: target reached
1st target achieved today
Access the powerful Demand and Supply Zone Pro indicator at:
marketup2date.com
Stay updated on Telegram:
t.me/MarketUp2Date
Join our WhatsApp channel:
whatsapp.com/channel/0029Va6ByyH0LKZCc4Az4x0u
marketup2date.com
Stay updated on Telegram:
t.me/MarketUp2Date
Join our WhatsApp channel:
whatsapp.com/channel/0029Va6ByyH0LKZCc4Az4x0u
Related publications
Disclaimer
The information and publications are not meant to be, and do not constitute, financial, investment, trading, or other types of advice or recommendations supplied or endorsed by TradingView. Read more in the Terms of Use.