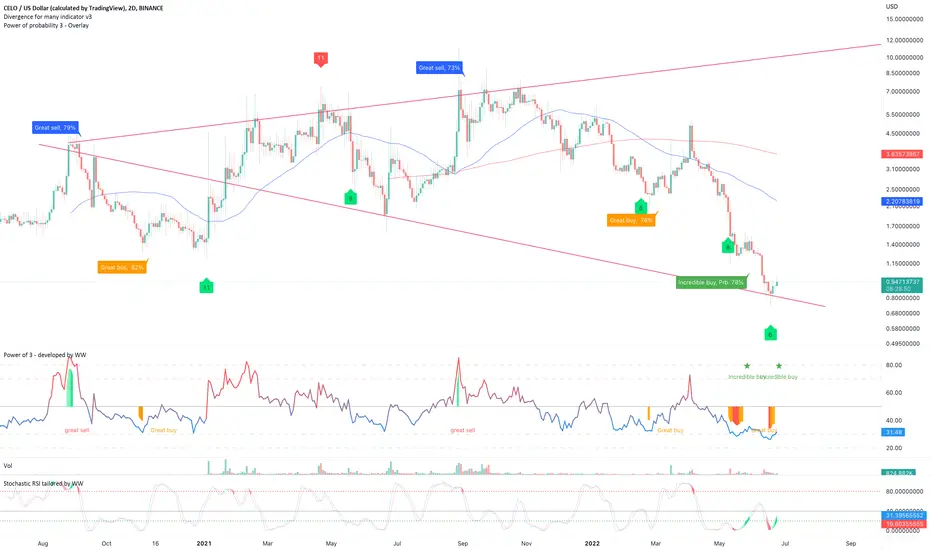
On the above 2-day chart price action has corrected 90% since the sell signal last August. A number of reasons now exist to be bullish, including:
1) The ‘incredible buy’ signal.
2) Regular bullish divergence. Multiple oscillators are printing positive divergence with price action. A very similar picture on the 2-day BTC pair (below).
3) RSI resistance breakout.
4) Price action is now testing a trend line of significant historical support and resistance.
Is it possible for price action to fall further? For sure.
Is it probable? Very unlikely.
Ww
Type: trade
Risk: <=6% of portfolio
Timeframe: 3 - 8 month
Return: Somewhere between $10-15
BTC pair
Note
PS: This one is on the 'what if' list.Related publications
Disclaimer
The information and publications are not meant to be, and do not constitute, financial, investment, trading, or other types of advice or recommendations supplied or endorsed by TradingView. Read more in the Terms of Use.
Related publications
Disclaimer
The information and publications are not meant to be, and do not constitute, financial, investment, trading, or other types of advice or recommendations supplied or endorsed by TradingView. Read more in the Terms of Use.