Full Breakdown: CHF/USD – Double Top Reversal Pattern (15-Minute Chart)
🕵️♂️ 1. Market Context and Background
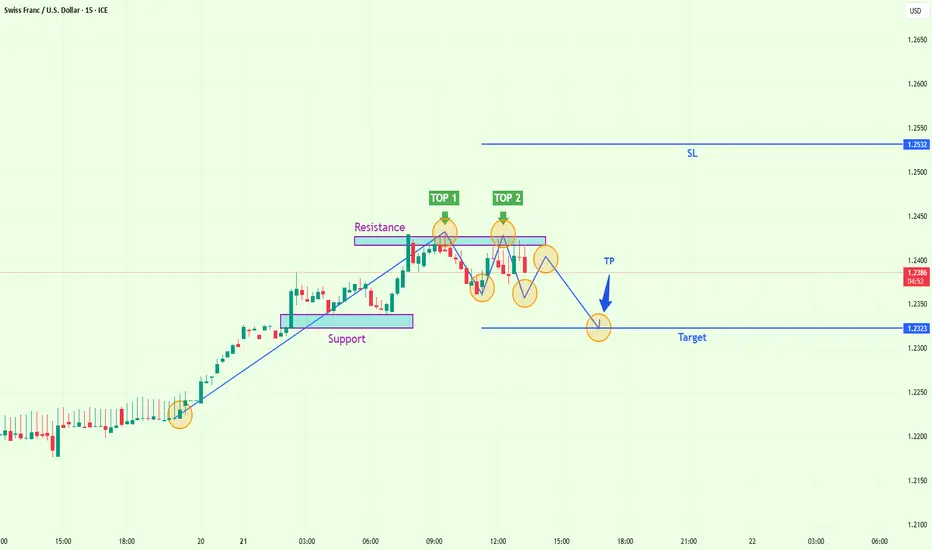
On this 15-minute CHF/USD chart, we observe a strong bullish rally that has now reached a technical exhaustion point. The market rallied from a consolidation base, creating higher highs and higher lows — until momentum began to falter at a well-defined resistance zone.
This pause in momentum transitioned into a distribution phase, signaling potential for a short-term trend reversal. The emerging Double Top pattern marks a clear shift in sentiment as buyers fail to maintain dominance.
📐 2. Key Price Zones & Structural Elements
🟪 Support Zone (Accumulation Phase)
Around 1.2320–1.2335, a base was formed, indicating accumulation.
Price broke out of this zone with strong bullish candles, signaling aggressive buying.
🟩 Uptrend Phase
After breaking support, price surged upward in impulsive candles.
This rally created a steep bullish trendline, which was respected until the resistance level was hit.
🟥 Resistance Zone (Distribution Phase)
Price found strong resistance at 1.2405–1.2415.
Two attempts to break this level failed, forming the Double Top (TOP 1 and TOP 2).
🔄 3. The Double Top Pattern – Explained Technically
📉 What It Is:
A Double Top is a classic bearish reversal pattern, signaling that buying pressure is weakening. After a strong bullish run, price fails to make a new high on the second attempt and reverses.
📍 Pattern Components:
Top 1: Initial high formed at the resistance level.
Valley: Pullback to neckline support around 1.2370.
Top 2: Second rejection at the same resistance. Often slightly lower or equal to the first.
Neckline: The level of support between the two tops — the critical zone for confirmation.
📉 4. Trade Setup and Execution Plan
✅ Entry Strategy
Wait for clear break below the neckline (~1.2370).
Ideal entry is on the retest of broken support, which often flips into resistance.
Confirmation can be added with bearish candlestick formations (e.g., bearish engulfing, shooting star, strong wick rejection).
🔒 Stop Loss (SL)
Placed above the recent highs / resistance zone at 1.2532.
Gives enough room to avoid fakeouts while managing risk.
🎯 Take Profit (TP)
Primary TP level is set at 1.2323, which aligns with:
Previous consolidation zone
Measured move from the Double Top height
This offers a strong risk-to-reward ratio (typically 1:2 or better).
🔍 5. Market Psychology Behind the Pattern
Top 1: Initial buyer euphoria hits a supply zone.
Pullback: Some buyers take profit; early sellers enter.
Top 2: Buyers try again but fail, showing fading momentum.
Breakdown: Sellers overwhelm remaining buyers at the neckline — triggering a shift in market control.
This psychological transition is often fast, especially on lower timeframes, making the retest an optimal entry point.
📘 6. Risk Management Tips
Use position sizing based on account risk (e.g., 1–2%).
Watch for false breakouts — avoid entering until retest confirms rejection.
Monitor volume or momentum indicators (optional) to confirm divergence or weakness near resistance.
📝 Conclusion
This CHF/USD chart shows an ideal Double Top setup supported by:
Clear structure
Strong resistance level
Reversal signals
Defined SL and TP zones
It represents a high-probability trade for short sellers anticipating a bearish move after trend exhaustion.
✅ “The best setups aren’t just about price patterns — they’re about reading the story behind the candles. This one tells us that bulls have likely lost control, and sellers are ready to step in.”
🕵️♂️ 1. Market Context and Background
On this 15-minute CHF/USD chart, we observe a strong bullish rally that has now reached a technical exhaustion point. The market rallied from a consolidation base, creating higher highs and higher lows — until momentum began to falter at a well-defined resistance zone.
This pause in momentum transitioned into a distribution phase, signaling potential for a short-term trend reversal. The emerging Double Top pattern marks a clear shift in sentiment as buyers fail to maintain dominance.
📐 2. Key Price Zones & Structural Elements
🟪 Support Zone (Accumulation Phase)
Around 1.2320–1.2335, a base was formed, indicating accumulation.
Price broke out of this zone with strong bullish candles, signaling aggressive buying.
🟩 Uptrend Phase
After breaking support, price surged upward in impulsive candles.
This rally created a steep bullish trendline, which was respected until the resistance level was hit.
🟥 Resistance Zone (Distribution Phase)
Price found strong resistance at 1.2405–1.2415.
Two attempts to break this level failed, forming the Double Top (TOP 1 and TOP 2).
🔄 3. The Double Top Pattern – Explained Technically
📉 What It Is:
A Double Top is a classic bearish reversal pattern, signaling that buying pressure is weakening. After a strong bullish run, price fails to make a new high on the second attempt and reverses.
📍 Pattern Components:
Top 1: Initial high formed at the resistance level.
Valley: Pullback to neckline support around 1.2370.
Top 2: Second rejection at the same resistance. Often slightly lower or equal to the first.
Neckline: The level of support between the two tops — the critical zone for confirmation.
📉 4. Trade Setup and Execution Plan
✅ Entry Strategy
Wait for clear break below the neckline (~1.2370).
Ideal entry is on the retest of broken support, which often flips into resistance.
Confirmation can be added with bearish candlestick formations (e.g., bearish engulfing, shooting star, strong wick rejection).
🔒 Stop Loss (SL)
Placed above the recent highs / resistance zone at 1.2532.
Gives enough room to avoid fakeouts while managing risk.
🎯 Take Profit (TP)
Primary TP level is set at 1.2323, which aligns with:
Previous consolidation zone
Measured move from the Double Top height
This offers a strong risk-to-reward ratio (typically 1:2 or better).
🔍 5. Market Psychology Behind the Pattern
Top 1: Initial buyer euphoria hits a supply zone.
Pullback: Some buyers take profit; early sellers enter.
Top 2: Buyers try again but fail, showing fading momentum.
Breakdown: Sellers overwhelm remaining buyers at the neckline — triggering a shift in market control.
This psychological transition is often fast, especially on lower timeframes, making the retest an optimal entry point.
📘 6. Risk Management Tips
Use position sizing based on account risk (e.g., 1–2%).
Watch for false breakouts — avoid entering until retest confirms rejection.
Monitor volume or momentum indicators (optional) to confirm divergence or weakness near resistance.
📝 Conclusion
This CHF/USD chart shows an ideal Double Top setup supported by:
Clear structure
Strong resistance level
Reversal signals
Defined SL and TP zones
It represents a high-probability trade for short sellers anticipating a bearish move after trend exhaustion.
✅ “The best setups aren’t just about price patterns — they’re about reading the story behind the candles. This one tells us that bulls have likely lost control, and sellers are ready to step in.”
Related publications
Disclaimer
The information and publications are not meant to be, and do not constitute, financial, investment, trading, or other types of advice or recommendations supplied or endorsed by TradingView. Read more in the Terms of Use.
Related publications
Disclaimer
The information and publications are not meant to be, and do not constitute, financial, investment, trading, or other types of advice or recommendations supplied or endorsed by TradingView. Read more in the Terms of Use.