$NU - Look out belowww! Falling KnifeChart #35/ 40: NYSE:NU
-Double Top Breakdown look for retest and confirmation
-L5 Indicator is RED
-Williams R% needs to create Resistance for this Low 5 Setup to establish the Williams consolidation box.
-AVP almost at volume shelf, if it breaks that another big gap down.
🎯$11.75📏$10.62⏳ Before APR25
NFA
Double Top

XRP ChartThere is Bearish Divergence and Also Pattern of Double Top. Will take Sell entry at the breakdown of Neckline

DELL - Large Double TopA clear Double Top on this Weekly timeframe, a good time to sell into the bearish movement.
I expect price to move down towards the upward trend line in green and recover from there.
Bearish

GBPJBY - BEARISH DOUBLE TOPHello Traders !
On Monday 28 Oct, The GBPJPY reached the resistance level (198.662 - 199.522).
The price formed a double top pattern.
Currently, The neckline is broken !
So, I expect a bearish move📉
_______________
TARGET: 190.790🎯

SPY Double Top Triple Top?Possible Double or Triple Top on AMEX:SPY ?
The SPY has been hitting the same resistance level of 600.80 for the past two days. First, on November 24, 2024, and again on November 25, 2024, before pulling back.
This repeated testing of the same level raises the question: are we forming a double or triple top? Will the SPY fail to break through this level, or will it finally push past it?
Only time will tell, but we should be aware of this potential technical pattern.
Double Top
Two consecutive peaks: Two highs occur near the same price level, with a moderate decline between them.
Valley in between: A noticeable low forms between the two peaks, which serves as a support level.
Neckline: A line connecting the valley lows forms the neckline.
Breakdown: The price breaks below the neckline, confirming the Double Top pattern.
Volume: Decreasing volume on the second peak and increasing volume on the breakdown.

NVDA Topping PatternUnlike the previous call, I made in NVDA that was corrective.
This double-top pattern is signaling a reversal pattern.
From a trading perspective, this is a great risk/reward setup that is relatively simple. A CRACK! here will likely lead to at least the right side filling, with the potential deeper pullback (reversal)
If on the other hand, it pops above recent highs then no trade or an easy stop out.
As you all know I don't do targets, I think they are silly and only used to pretend one has such insight not only can they call the move but also a "target" too. Yeah well, I'll leave that to the "experts" ;)
Bulls don't be a dick for tick.
Shorts take some early profits to improve cost basis but let this one ride!

GBPCAD - Bearish Double TOPHello Traders !
The GBPCAD failed to create a new higher high !
The price formed a double top pattern.
Currently, The neckline is broken 🔥
So, I predict a bearish move📉
_____________
TARGET: 1.74620🎯

XAUUSD Bearish Reversal: Double Top and Golden Pocket Breakdown!OANDA:XAUUSD - 2Hr
The analysis suggests the market is showing bearish signals, particularly after price rejected at key resistance zones during the Asian session. The Ascending Channel indicates an upward trend, but the breakdown from the channel signals that bullish momentum is weakening.
Key Elements Driving the Short Trade:
1. Golden Pocket (0.5–0.618 Fib):
The price has reached the Golden Pocket (between 0.5 and 0.618 Fibonacci levels), a strong reversal zone. Rejections in this zone often signal a potential change in trend, especially when combined with other bearish signals.
2. MML Major Resistance:
The MML Major Resistance suggests that the market is encountering a significant obstacle, further validating the potential for a reversal.
3. Strong Resistance:
The price is facing Strong Resistance at higher levels, which is causing the price to struggle and reject, confirming the reversal bias.
4. Double Top:
The Double Top pattern at the Golden Pocket indicates that the price has attempted to break higher twice but failed, signaling weakness and a likely bearish shift. This pattern often leads to a trend reversal.
5. Price Gap:
A Price Gap further confirms a shift in market sentiment, with a possible imbalance or sudden price movement that reinforces the bearish view.
Current Price Action:
During the Asian session, price broke down from the Ascending Channel, signaling a shift from an uptrend to a potential downtrend. The breakdown occurred near Equilibrium and the 50% Fib retracement, reinforcing the idea of a reversal as this is where price typically finds resistance in a trend. The Double Top at the Golden Pocket suggests a strong potential for a downward move as the price has failed to continue higher. Currently, the price is above a Strong Pivot Point, which is acting as support, potentially leading to a short-term pullback or consolidation before the bearish move continues.
Interpretation:
The combination of the Golden Pocket, Double Top, and rejection at key resistance levels gives a strong bearish signal. The ideal entry point would be after confirmation of price breaking below the Strong Pivot Point or failing to sustain above it, with a target near the next support or at Price Gap, as mentioned Price target. Place the stop loss just above the Double Top or near the Strong Resistance zone to limit risk in case the market reverses back up.
In conclusion, the market is showing signs of a bearish reversal after rejection at multiple key levels, and the analysis points toward potential short opportunities with proper risk management.
"Stick to Your Plan and Manage Risk, Happy Trading!"

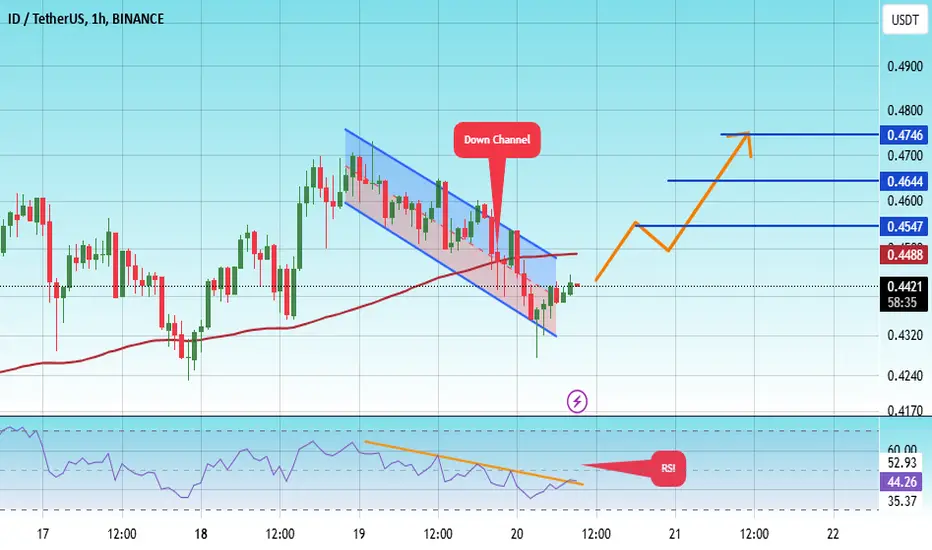
#ID/USDT Ready to go up#ID
The price is moving in a descending channel on the 1-hour frame and sticking to it well
We have a bounce from the lower limit of the descending channel, this support is at 0.4320
We have a downtrend, the RSI indicator is about to break, which supports the rise
We have a trend to stabilize above the moving average 100
Entry price 0.4428
First target 0.4547
Second target 0.4644
Third target 0.4746
A Crypto on a journey from bigger Time-F's & Big move-up
I have been following HBARUSD for a bit over a week. I was wondering why it was getting huge volumes lately. Hidden away on higher time frames 'monthly' & 'weekly' charts reveals the reasons volume and buying is on increase.
Price breaking out of a triangle on Monthly chart very, very recently and price moving back to retest this breakout and give buyers another opportunity at the better price.
Weekly chart is a Top 2 and price snapping back to retest the Top of this system.
A good trade with a longer term view, or cash in on the short term with its volatility supportive of long prices.

BTC Doulbe Top pull back ShortAfter hitting all time high 93.3K
BTC create doulbe top and pull back to 0.786 level
now price alreayd shows negative price acion
therefore we can SHORT Btc
and aim
86K
Good Luck!
82K
77K

Bullish Double Bottom Pattern Tutorial: 4/8 Bullish PatternsGive me the description for a bullish double-bottom
A bullish double bottom is a powerful reversal chart pattern that signals the potential end of a downtrend and the beginning of an upward trend. Here’s how it forms:
Two Troughs: The pattern starts with a significant price decline, forming a low (the first bottom). The price then rebounds to create a peak (the middle of the "W" shape) but soon declines again to form a second bottom roughly at the same price level as the first bottom. This double bottom resembles the letter "W."
Neckline: The horizontal line that connects the peak of the middle rebound is called the neckline. This is a key resistance level that the price needs to break through to confirm the pattern.
Breakout: A breakout above the neckline, typically accompanied by increased volume, confirms the double bottom pattern and signals a potential trend reversal from bearish to bullish.
Price Target: The estimated price target for the upward move is usually determined by measuring the distance from the bottoms to the neckline and projecting this distance upwards from the point of breakout.
Traders view the double bottom as a strong indication that the previous downtrend has exhausted and the bulls are gaining control, leading to a potential significant upward movement.

USD/CAD 4H Bearish Double Top with RSI Divergence Trade SetupUSD/CAD 4-hour chart is forming a bearish double top pattern near a resistance zone, signaling a potential reversal. The RSI shows bearish divergence, with the price making higher highs while RSI trends lower, indicating weakening upward momentum. This setup suggests that a bearish move is likely if the price breaks below the key support level at 1.38138, which is the designated sell entry level in the plan. The stop loss is set above the double top, at 1.39624, to protect against a breakout above resistance.
For targets, Take Profit Level 1 is set at 1.36665, while Take Profit Level 2 is positioned at 1.35443, aligning with lower support levels that could serve as points for a potential reversal or pause in the downtrend. The plan projects the double top breakdown using a red line labeled "Projection of DT," indicating the estimated move downward if the pattern completes. This trade strategy utilizes confluence between price action, RSI divergence, and a clear breakdown structure to establish a high-probability short trade setup.

GBP/CAD D1: Potential Breakout from Rising Wedge with Double TopOn the daily chart of GBP/CAD, I’ve identified a Rising Wedge pattern with a Double Top formation within it, signaling a strong potential for a significant bearish movement. A similar pattern previously occurred on September 9, 2023, when a bearish breakout from the Rising Wedge was confirmed by a double top, followed by a sharp downtrend.
Currently, the same pattern has reappeared, with the price forming the second peak of the double top, but a breakout confirmation is still pending. The next price movement is illustrated by blue arrows, indicating the expected downward direction if a breakout occurs. Additionally, the breakout area is marked with a red rectangle to clarify the critical support level that needs to be breached, while the double top’s peak is highlighted with an orange circle to emphasize this key pattern level.
The strategy plan here is to wait for a breakout below the Rising Wedge support line to open a sell position. The profit target is set at the 1.7310 level, with a stop loss placed above the double top level, around 1.8200. If a breakout confirmation occurs, the bearish movement is expected to drive the price closer to the set profit target.

GOLD ChartThere is Bullish momentum. But there is Bearish divergence and also have the Trend reversal pattern of Double Top. So, will take Sell entry at Breakdown of the Neckline and Stoploss at Few pips above double top.

Bitcoin - DOUBLE TOP Weekly TimeframeA Double top in the weekly timeframe is never a good sigh - however, all is not yet lost.
One final pattern remains to be seen - and that is the Bump and Run method. Perhaps we can bump that diagonal support around 65k, retest the bulls' determination - and then make the final impulse wave up.
There is a fakeout observed on Dogecoin as well, and alts that have increased alongside BTC over the past week will likely fall pretty hard IF Bitcoin cannot keep closing ABOVE 65K.
______________________
BINANCE:BTCUSDT

AUDUSD - Bearish Double TOPHello Traders !
The AUDUSD price formed a double top pattern.
Currently, The neckline is broken !
So, I expect a bearish move📉
________________
TARGET: 0.66670🎯

EU Double Top Breaks Rising Support, 300+ Pip Sell Set-Up!Here I have FX:EURUSD on the Daily Chart!
After last weeks Double Top was Confirmed, we see Price make a Bearish Break to and through the Rising Support created by the April, June and August Lows.
-The Testing Candle alone generates ~500K in Selling Volume making the Rising Support weak enough to then Break Down to where price sits now.
Applying the Fibonacci Retracement Tool from the Higher High @ 1.12138 to the Lower Low @ 1.08107, we can see a couple things:
*23.6% Level sits right at the 200 EMA which is curving down and Price is now trading Below
*38.2% Level sits right in the center of the Resistance Zone created from the March Highs
*50% Level is at the Higher Low that was Broken to Confirm the Double Top
I suspect that Price will need to Retest the Break of Rising Support before it can continue to Push Down!
Potential Set-Up: Sell Entry
1.09058 (23.6%) - 1.09647 (38.2%)
SL - 1.10112 (50%)
TP - 1.0665

EURUSD → Active sale. Emphasis on 1.0900FX:EURUSD continues to update lows since the fundamental background and uptrend change. Price is descending in a calm and progressive manner, which generally indicates the strength of the trend...
A strong drop from the distribution phase without any pullbacks is an indicator of a strong trend. There is a key liquidity zone ahead, which could form a surge in volume and liquidity that could lead to a small correction. For example to 1.095 - 0.7 fibo. On the Daily chart we see the realization of a failed breakout (false breakout), a strong distribution is formed. The liquidity at 1.077 - 1.067 may become the target of such a movement
Resistance levels: 1.095, 1.100
Support levels: 1.089, 1.077
There is no news until Wednesday, so the fundamental background remains the same. The market may stop and go into consolidation, but with a high probability the fall after the breakthrough of 1.089 will continue...
Rate, share your opinion and questions, let's discuss what's going on with ★ FX:EURUSD ;)
Regards R. Linda!

EURUSD - Bearish Double TOPHello Traders !
The EURUSD failed to create a new higher high,
The price formed a double top pattern.
Currently, The neckline is broken🔥
______________
TARGET: 1.08180🎯

Technical Analysis of Digital Turbine (APPS)Looking at the stock's (APPS) historical performance, we can see a long lateral phase that lasted about 10 years. It broke out of this sideways trend with a strong bullish rally, reaching a peak of around $100. After that, the uptrend ended, and a downward phase began, following the formation of a Double Top technical pattern.
The downtrend appears to have stopped near a support zone.
When zooming in with a lower timeframe, we notice that the downtrend halted around this area. The stock broke a descending trendline and formed a bullish Head and Shoulders pattern. The neckline was broken with strength, accompanied by a substantial increase in volume, coinciding with the release of earnings and revenue reports.
After the strong rally, the stock retraced and is now sitting at the Point of Control (POC) of a key volume area, which considers the entire history of the stock.
Bullish Scenario
The stock seems to be in a rebound phase after touching the POC. A continued upward movement could target the $7 area, which aligns with another significant volume area.
Bearish Scenario
If the POC area fails to hold, one could consider entering at the $1 level, which corresponds to a support area.
Note of Caution: The stock has experienced a massive loss over three years, dropping from $100 to around $1.50. Therefore, it’s crucial to proceed with caution when evaluating this stock.

NVIDIA GOING TO $75?? Unlikely but the chart shows...We have a DOUBLE TOP AND A RISING WEDGE with a price target of $75 on the daily chart. It seem unlikely but there is a big old gap from back in Feb 2024 at $75. There is another gap that needs to be filled around $119 that seem more likely. IMO the market like to balance itself by filling the gaps it leaves behind. The RSI looks to of topped out and is also curving over. Its very unlikely for NASDAQ:NVDA to drop that far down, but down to $119 seems likely before a possible Christmas rally (and wash sales) in late DEC. NVDA is such a strong company and demand for its chips is high, I really don't like the looks of that Double Top combined with a Rising Wedge. Safe Trading everyone!! (Charts are only part of the bigger picture especially with Nvidia, it is a beast of a company and who wouldn't love the opportunity to buy more NVDA at $75)

Silver finds Support for Buy orders....Shine is all on Crypto
Silver Sold Off due to a Double Top and it found support about an hour ago but failed to really take-off probably due to all the buying on Crypto today.
But at these levels for Silver following a recent 1.3% sell off due to this Double Top for Silver, it looks as though price is retracing back to higher higher prices.
