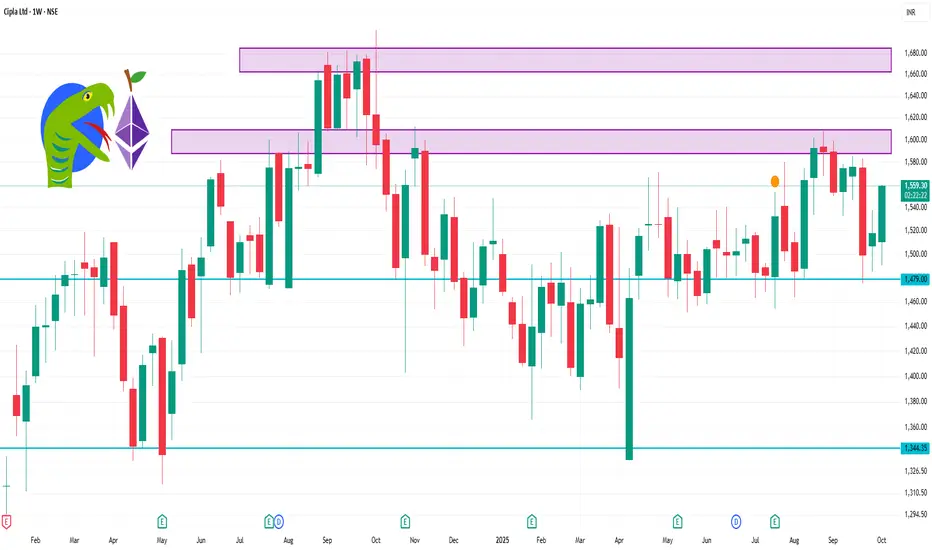
📈 Weekly Support & Resistance Levels
Support Levels:
S1: ₹1,491.53
S2: ₹1,499.17
S3: ₹1,506.48
S4: ₹1,514.12
Resistance Levels:
R1: ₹1,521.43
R2: ₹1,529.07
R3: ₹1,536.38
R4: ₹1,544.70
These levels are derived from the classic pivot point method and can serve as potential entry or exit points for traders.
Technical Indicators Snapshot
Relative Strength Index (RSI): 77.43 (approaching overbought territory)
MACD: 7.01 (bullish crossover)
Average Directional Index (ADX): 30.49 (indicating a strong trend)
Commodity Channel Index (CCI): 307.2 (overbought)
Williams %R: -0.79 (overbought)
Rate of Change (ROC): 3.81% (bullish momentum)
Moving Averages:
5-day: ₹1,527.76
50-day: ₹1,510.91
200-day: ₹1,542.76
Related publications
Disclaimer
The information and publications are not meant to be, and do not constitute, financial, investment, trading, or other types of advice or recommendations supplied or endorsed by TradingView. Read more in the Terms of Use.
Related publications
Disclaimer
The information and publications are not meant to be, and do not constitute, financial, investment, trading, or other types of advice or recommendations supplied or endorsed by TradingView. Read more in the Terms of Use.