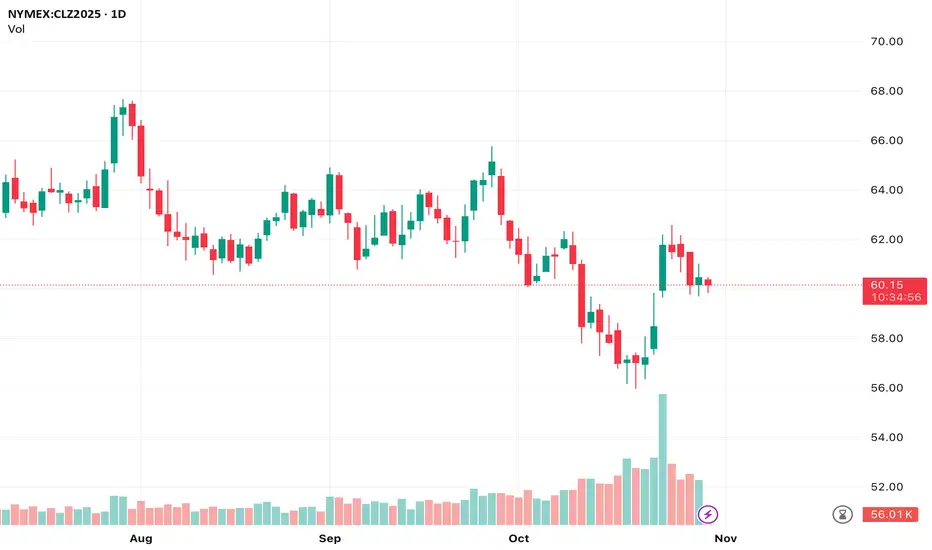
Crude Oil Futures (Dec 2025) Daily Chart Analysis
Price is trading around 60.15 after a bounce from the 56 area. The recent move up has slowed, shown by smaller candles and reduced volume. Structure shows a lower-high pattern overall, but the market is currently holding above a short-term higher low. This suggests consolidation, not a confirmed trend continuation yet.
Key Levels:
Resistance at 62. Price has rejected this zone twice.
Support at 60. Market is sitting just above this level.
Major support at 56. Strong reaction level where price last bounced.
What I See:
Volume increased on the push up, then faded.
Recent candles show hesitation, indicating indecision.
Price is ranging between 60 support and 62 resistance.
Bullish Scenario:
A break and daily close above 62 would signal upside momentum.
Targets: 64 then 67.
Bearish Scenario:
A break and close below 60 sets up a move toward 58 and potentially a retest of 56.
Current Bias:
Neutral. Price is consolidating. Waiting for a clear breakout or breakdown is prudent.
Range trades are possible between 60 and 62 with tight risk management.
Catalysts to Watch:
Crude reacts strongly to fundamentals including geopolitical events, US inventory data, and OPEC communication. Manage risk accordingly.
Follow for more. Happy Trading.
The Professor
Unite. Learn. Succeed.
Armando
"The Professor"
Armando
"The Professor"
Disclaimer
The information and publications are not meant to be, and do not constitute, financial, investment, trading, or other types of advice or recommendations supplied or endorsed by TradingView. Read more in the Terms of Use.