Executive Summary:
 CMPO is presenting a compelling technical setup as it approaches its next significant catalyst: an earnings report scheduled for Wednesday, March 11, 2026. Historical price action suggests the stock has a tendency to exhibit strength around its earnings period, with a notable precedent occurring last year. The current chart structure has defined three critical technical support levels that offer a clear roadmap for risk assessment and potential entry, making it a stock of high interest in the coming weeks.
Detailed Analysis:
1. The Upcoming Earnings Catalyst
The primary market-moving event on the horizon is the company's earnings release, confirmed for Wednesday, March 11, 2026. Earnings reports often act as major volatility catalysts, capable of definitively breaking a stock out of a consolidation pattern or confirming an existing trend. All technical analysis in the immediate term is contextualized by this upcoming event.
2. Historical Precedent: Seasonal Strength
A review of historical performance reveals a potentially bullish seasonal pattern. In the previous year, around Wednesday, March 6, 2025,CMPO began to demonstrate notable upward momentum. This historical strength preceding the earnings period is a critical factor. It suggests the possibility of a repeat pattern, where investor optimism or positive sentiment begins to build in anticipation of the report, providing a tailwind for the stock price.
3. Critical Technical Support Hierarchy
The most compelling aspect of the current setup is the clear definition of three distinct support levels. These zones provide a structured framework for managing risk and identifying potential areas of value. They are outlined below in order of immediate to long-term significance:
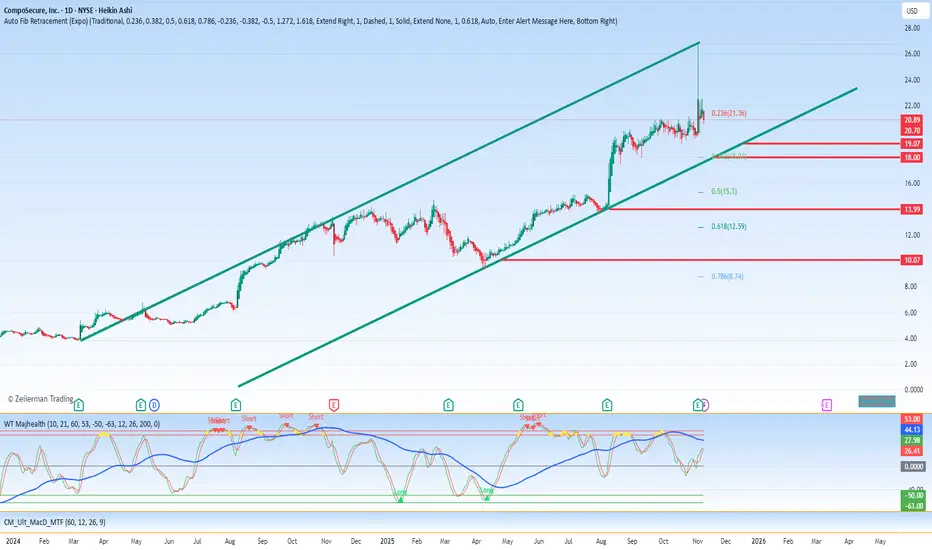
Primary Support (Resistance Turned Support) at $18.00: This is the first and most immediate key level. A successful hold above $18, especially following a prior breakout, would signal strong underlying demand and maintain the bullish near-term structure. This level is likely a prior resistance that has now reversed its role to become support.
Significant Support (The High-Conviction Zone) at $14.00: This represents a more substantial support area. A retracement to this level would likely be seen as a deeper, yet potentially healthier, pullback that could offer a higher-conviction entry point for traders believing in the longer-term thesis. A bounce from $14 would strongly reinforce the overall bullish trend.
Fundamental Support (The Long-Term Foundation) at $10.00: This is considered the ultimate support and a critical long-term floor. A decline to this level would likely represent a major market reassessment of the stock's value, potentially invalidating the near-term bullish thesis. However, from a risk-management perspective, it also represents a level where the stock would be deemed deeply undervalued, attracting strong strategic buying interest.
Conclusion and Strategic Outlook:
In summary,CMPO is positioned at a critical technical juncture with a major catalyst on the horizon. The convergence of a historically strong seasonal period and well-defined support levels creates a scenario ripe for opportunistic trading.
The strategic approach would be to monitor the stock's price action relative to the $18.00 and $14.00 support levels in the weeks leading up to the March 11, 2026, earnings. Any signs of strengthening or bullish reversal patterns at these levels could signal an attractive risk/reward setup ahead of the earnings report. The $10.00 level serves as a crucial long-term invalidation point for the bullish thesis.
Detailed Analysis:
1. The Upcoming Earnings Catalyst
The primary market-moving event on the horizon is the company's earnings release, confirmed for Wednesday, March 11, 2026. Earnings reports often act as major volatility catalysts, capable of definitively breaking a stock out of a consolidation pattern or confirming an existing trend. All technical analysis in the immediate term is contextualized by this upcoming event.
2. Historical Precedent: Seasonal Strength
A review of historical performance reveals a potentially bullish seasonal pattern. In the previous year, around Wednesday, March 6, 2025,
3. Critical Technical Support Hierarchy
The most compelling aspect of the current setup is the clear definition of three distinct support levels. These zones provide a structured framework for managing risk and identifying potential areas of value. They are outlined below in order of immediate to long-term significance:
Primary Support (Resistance Turned Support) at $18.00: This is the first and most immediate key level. A successful hold above $18, especially following a prior breakout, would signal strong underlying demand and maintain the bullish near-term structure. This level is likely a prior resistance that has now reversed its role to become support.
Significant Support (The High-Conviction Zone) at $14.00: This represents a more substantial support area. A retracement to this level would likely be seen as a deeper, yet potentially healthier, pullback that could offer a higher-conviction entry point for traders believing in the longer-term thesis. A bounce from $14 would strongly reinforce the overall bullish trend.
Fundamental Support (The Long-Term Foundation) at $10.00: This is considered the ultimate support and a critical long-term floor. A decline to this level would likely represent a major market reassessment of the stock's value, potentially invalidating the near-term bullish thesis. However, from a risk-management perspective, it also represents a level where the stock would be deemed deeply undervalued, attracting strong strategic buying interest.
Conclusion and Strategic Outlook:
In summary,
The strategic approach would be to monitor the stock's price action relative to the $18.00 and $14.00 support levels in the weeks leading up to the March 11, 2026, earnings. Any signs of strengthening or bullish reversal patterns at these levels could signal an attractive risk/reward setup ahead of the earnings report. The $10.00 level serves as a crucial long-term invalidation point for the bullish thesis.
Disclaimer
The information and publications are not meant to be, and do not constitute, financial, investment, trading, or other types of advice or recommendations supplied or endorsed by TradingView. Read more in the Terms of Use.
Disclaimer
The information and publications are not meant to be, and do not constitute, financial, investment, trading, or other types of advice or recommendations supplied or endorsed by TradingView. Read more in the Terms of Use.