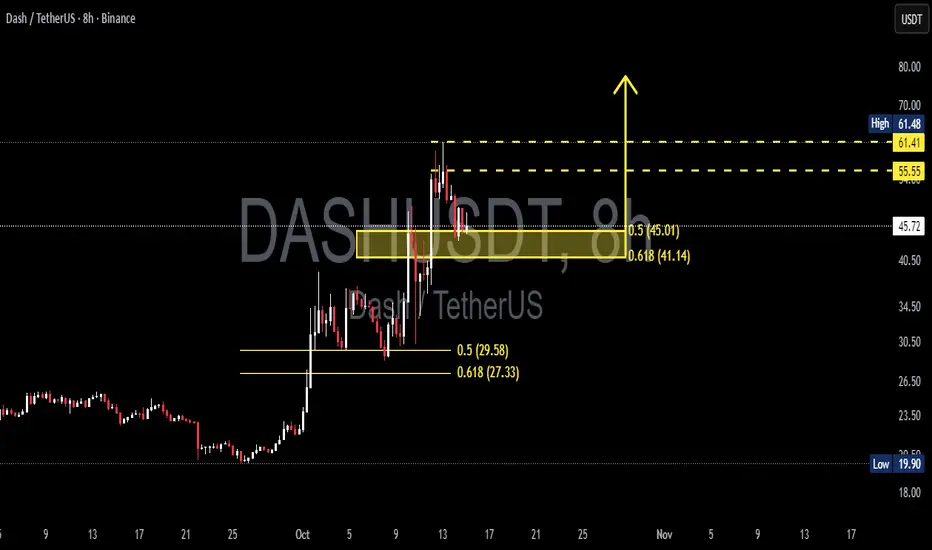
The price of DASH/USDT is now standing at a critical decision zone. After breaking out from a long consolidation phase, DASH experienced a strong rally toward 61.4 USDT, followed by a healthy correction into the golden pocket (0.5–0.618 Fibonacci retracement) area between 45.0–41.1 USDT.
This region now acts as the battleground between buyers and sellers, which will determine whether the bullish trend continues or fades.
---
🔶 Technical Overview & Key Levels
Timeframe: 8 Hours
Current Price: ~46.4 USDT
Key Zones:
Main Support / Retest Area: 45.01 – 41.14 USDT
Primary Resistance: 55.55 USDT
Major Resistance: 61.41 – 61.48 USDT
Next Supports (if breakdown occurs): 29.6 – 27.3 USDT
Major Low / Last Defense: 19.9 USDT
This corrective move toward the golden pocket shows a healthy retracement structure within an impulsive trend — suggesting that the market might be cooling off before attempting another leg higher.
---
🟩 Bullish Scenario — Golden Pocket as the Launchpad
If price can hold above 41.1 USDT and show strong bullish reaction (e.g., bullish engulfing candle, pinbar, or increasing volume), the golden pocket could become the launchpad for the next upward wave.
Bullish Confirmation:
8H close above 46.5 USDT
Increasing buy volume
Clear rejection wicks from 45–41 zone
Upside Targets:
TP1: 55.55 USDT (minor supply zone)
TP2: 61.4 USDT (previous high)
Stretch Target: 70.0 USDT if bullish momentum strengthens
Possible Strategy:
Conservative entry: After 8H close above 46.5
Aggressive entry: Within 43–45 zone with a tight stop below 41.0
---
🟥 Bearish Scenario — Failure to Defend the Golden Zone
If sellers manage to push the price below 41.1 USDT, with strong volume and a solid 8H close, the bullish structure weakens. This would signal potential for a deeper correction.
Bearish Confirmation:
8H candle closes below 41.1 USDT
Increased sell volume
Weak or no bullish reaction in the golden pocket
Downside Targets:
TP1: 29.6 USDT
TP2: 27.3 USDT
TP3 (final support): 19.9 USDT
Possible Strategy:
Enter short after 8H close below 41.1
Stop-loss above 45.0
---
📊 Pattern Structure
From a technical perspective, the current setup resembles a bullish flag / breakout retest pattern — where price pulls back gradually after a strong impulse.
The yellow box area highlights a potential accumulation or re-entry zone where buyers could step back in.
If DASH shows strong rejection candles or a surge in buy volume from this zone, it would validate the idea of the market recharging for the next upward leg.
---
⚖️ Conclusion
DASH is currently testing the golden Fibonacci zone (45–41 USDT) — a make-or-break area that will define the next medium-term move.
As long as price stays above this zone, the probability of a rebound toward 55–61 USDT remains strong.
However, a confirmed breakdown below 41.1 could trigger a deeper correction toward 30–20 USDT levels.
With volatility rising and structure tightening, DASH is entering a decision point — a zone where bulls must defend to maintain control, or risk a reversal led by sellers.
---
#DASH #CryptoAnalysis #TechnicalAnalysis #Fibonacci #CryptoTrading #Altcoins #PriceAction #MarketStructure #SwingTrade
✅ Get Free Signals! Join Our Telegram Channel Here: t.me/TheCryptoNuclear
✅ Twitter: twitter.com/crypto_nuclear
✅ Join Bybit : partner.bybit.com/b/nuclearvip
✅ Benefits : Lifetime Trading Fee Discount -50%
✅ Twitter: twitter.com/crypto_nuclear
✅ Join Bybit : partner.bybit.com/b/nuclearvip
✅ Benefits : Lifetime Trading Fee Discount -50%
Disclaimer
The information and publications are not meant to be, and do not constitute, financial, investment, trading, or other types of advice or recommendations supplied or endorsed by TradingView. Read more in the Terms of Use.