✅ Key current context
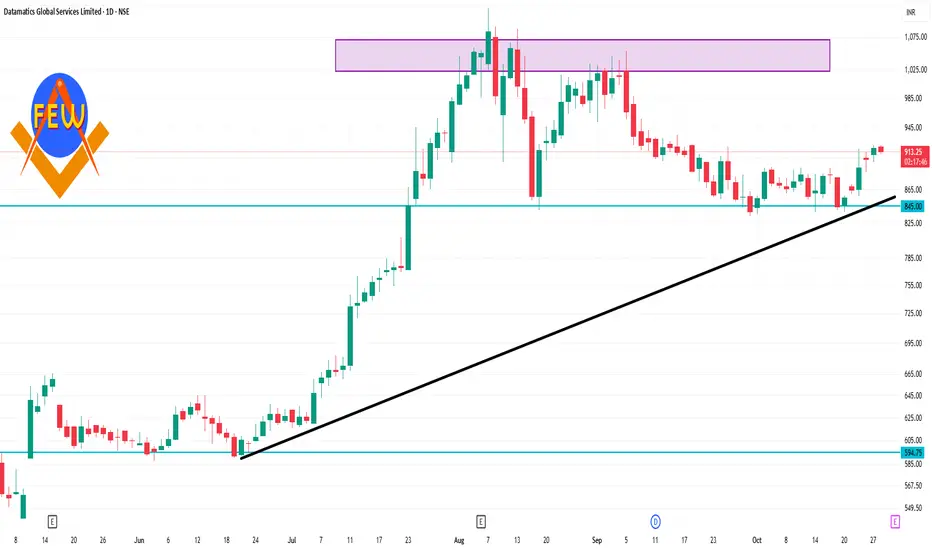
The stock is trading around ₹900-₹915 (last close ~₹903.60).
The 52-week high is ~ ₹1,120, low ~ ₹515.
Short-term momentum indicators show bullish bias: e.g., moving averages across 5, 10, 20, 50, 100, 200 days are all signalling “buy”.
Technical services list daily pivot/support/resistance levels for the stock.
Related publications
Disclaimer
The information and publications are not meant to be, and do not constitute, financial, investment, trading, or other types of advice or recommendations supplied or endorsed by TradingView. Read more in the Terms of Use.
Related publications
Disclaimer
The information and publications are not meant to be, and do not constitute, financial, investment, trading, or other types of advice or recommendations supplied or endorsed by TradingView. Read more in the Terms of Use.