Deepak Nitrite – Trend Reversal or Short-Term Pullback Rally?
📊 Chart Analysis (1D Timeframe)
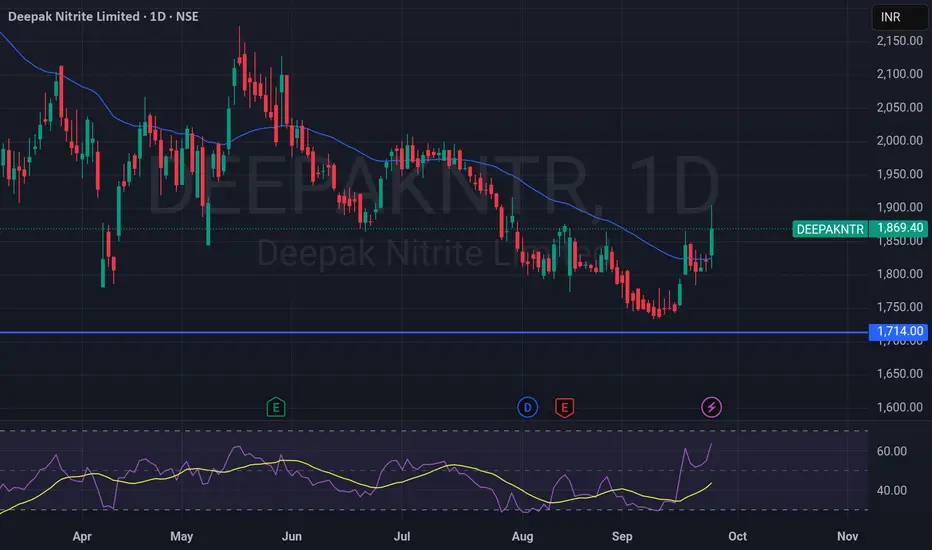
The stock has recently taken support near the ₹1,714 zone (marked as a strong support level).
Price has bounced sharply from this support and is now trading around ₹1,869, posting a +2.65% gain today.
The stock has closed above the 20-day moving average (blue line) for the first time after a prolonged downtrend – indicating a possible shift in momentum.
📈 RSI Indicator:
RSI has surged above the 60 level, showing increasing bullish momentum.
This suggests strength in the ongoing up-move, though it is entering a higher zone where profit-booking can also occur.
🔎 Key Levels to Watch:
Support: ₹1,714 (major support).
Immediate Resistance:₹1,900 – ₹1,920 zone (supply area).
Next Resistance: ₹1,975 – ₹2,000.
📌 Trading View:
The strong bounce from support + RSI breakout + price closing above the 20-day MA all hint at a potential short-term bullish reversal.
If the stock sustains above ₹1,850, it can attempt a move towards ₹1,920 – 1,975.
However, a close below ₹1,800 will weaken this bullish setup and may drag the stock back towards ₹1,714.
📊 Chart Analysis (1D Timeframe)
The stock has recently taken support near the ₹1,714 zone (marked as a strong support level).
Price has bounced sharply from this support and is now trading around ₹1,869, posting a +2.65% gain today.
The stock has closed above the 20-day moving average (blue line) for the first time after a prolonged downtrend – indicating a possible shift in momentum.
📈 RSI Indicator:
RSI has surged above the 60 level, showing increasing bullish momentum.
This suggests strength in the ongoing up-move, though it is entering a higher zone where profit-booking can also occur.
🔎 Key Levels to Watch:
Support: ₹1,714 (major support).
Immediate Resistance:₹1,900 – ₹1,920 zone (supply area).
Next Resistance: ₹1,975 – ₹2,000.
📌 Trading View:
The strong bounce from support + RSI breakout + price closing above the 20-day MA all hint at a potential short-term bullish reversal.
If the stock sustains above ₹1,850, it can attempt a move towards ₹1,920 – 1,975.
However, a close below ₹1,800 will weaken this bullish setup and may drag the stock back towards ₹1,714.
Disclaimer
The information and publications are not meant to be, and do not constitute, financial, investment, trading, or other types of advice or recommendations supplied or endorsed by TradingView. Read more in the Terms of Use.
Disclaimer
The information and publications are not meant to be, and do not constitute, financial, investment, trading, or other types of advice or recommendations supplied or endorsed by TradingView. Read more in the Terms of Use.