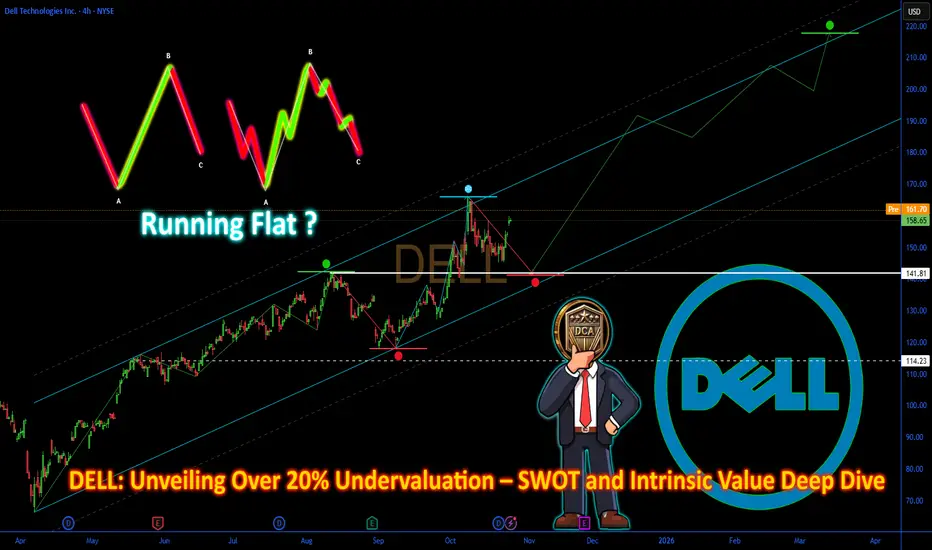
DELL: Unveiling Over 20% Undervaluation – SWOT and Intrinsic Value Deep Dive
Introduction
📊 As of October 27, 2025, Dell Technologies Inc. (DELL), a leading provider of IT hardware, software, and services with a focus on servers and storage, is capitalizing on AI-driven growth within the technology sector amid broader market volatility. Macroeconomic factors, including surging demand for AI infrastructure and data center expansions, have propelled positive investor sentiment despite recent fluctuations. Sector dynamics feature exploding AI server sales and enterprise upgrades, with public data indicating quarterly revenue growth of 19% year-over-year, positioning DELL for sustained momentum in a growth-oriented environment. This overview draws from verifiable metrics without endorsing any trading action.
SWOT Analysis
Strengths 💹
DELL boasts a strong brand reputation valued at billions and competency in mergers and acquisitions, enabling market expansion. Robust financials include adjusted EBITDA of $10.14B trailing twelve months and a profit margin of 4.77%, supported by diversified offerings in AI servers and storage solutions. Global presence and product customization further enhance operational efficiency, with operating cash flow at $7.48B.
Weaknesses ⚠️
Overdependence on the technology sector exposes DELL to cyclical downturns, while limited diversification and fewer physical points of sale hinder retail reach. High leverage is evident with total debt at $29.52B and negative book value per share of -$4.10, potentially amplifying risks in interest rate environments. Recent earnings surprises show variability, with a -8.38% miss in one quarter.
Opportunities 🚀
DELL is well-positioned for AI-driven growth, with analysts forecasting AI server sales surges and compounded annual revenue growth of 7-9% over the next four years. Undervalued metrics like a forward P/E of 13.11 and PEG ratio of 0.83 offer appeal, alongside opportunities in IoT and data storage demand. Projected revenue of $107.82B for fiscal 2026, up 12.82%, is driven by data center refresh cycles and enterprise AI adoption.
Threats 🛑
Intense competition in AI and cloud markets from rivals like HP and IBM could erode market share, while regulatory changes and supply chain disruptions pose risks. Geopolitical tensions and economic slowdowns may impact global operations, with beta of 1.13 indicating higher volatility relative to the market.
Intrinsic Value Calculation
💰 In value investing, estimating intrinsic value assesses mispricings, incorporating a margin of safety for factors like negative book value. Given DELL's negative book value (-$4.10 per share) due to leverage and buybacks, we adjust the book weight to 0 and emphasize earnings: Intrinsic Value = (Book Value per Share × Weight) + (Forward EPS × Growth Multiplier), where the multiplier (e.g., 20) reflects conservative capitalization for tech growth based on sector averages and 17% projected growth.
Using recent data: Book Value per Share = -$4.10, Forward EPS = $9.55. Assume a 17% growth rate from analyst estimates, supporting the multiplier for sustainability.
Calculation:
- Book component: -$4.10 × 0 = $0
- Earnings component: $9.55 × 20 = $191
- Intrinsic Value ≈ $0 + $191 = $191
Compared to the current price of approximately $158, DELL appears undervalued by over 20%, providing a substantial margin of safety (e.g., 30-50% discount recommended to offset risks like high debt). 📉 Debt flags are significant with $29.52B total debt, but strong earnings momentum (17.97% growth for 2027) supports long-term sustainability if managed. Annotate intrinsic value lines in green on the chart, with current price in red for visual comparison.
Entry Strategy Insights
🔍 Institutional investors often identify bottom-extreme zones, such as oversold conditions near historical supports, for unleveraged, long-term positions. A dollar-cost averaging framework allows gradual scaling during dips, using non-repainting price action signals to confirm reversals without bias. For DELL, monitor zones around 50-day moving averages amid AI growth trends, prioritizing fundamentals like revenue momentum over short-term noise.
Risk Management
⚠️ Position sizing at 1-5% of portfolio capital limits drawdowns. Diversify across tech and hardware sectors to reduce exposure to AI-specific risks, with long-term holds aligned to projected growth in server demand. Track leverage metrics in quarterly filings, establishing exit criteria for deteriorating macros or competition intensifying.
Conclusion
This analysis underscores DELL's strengths in AI infrastructure and financial growth, countered by leverage concerns, with opportunities in emerging tech trends. The intrinsic value calculation indicates notable upside for value investors, but always verify independently using latest filings and consult professionals.
This is educational content only; not financial advice. Always conduct your own due diligence.
⚡️ Request a trial or subscribe to our premium🛠️tools at ➡️DCAlpha.net
All scripts & content provided by DCAChampion are for informational & educational purposes only.
All scripts & content provided by DCAChampion are for informational & educational purposes only.
Disclaimer
The information and publications are not meant to be, and do not constitute, financial, investment, trading, or other types of advice or recommendations supplied or endorsed by TradingView. Read more in the Terms of Use.