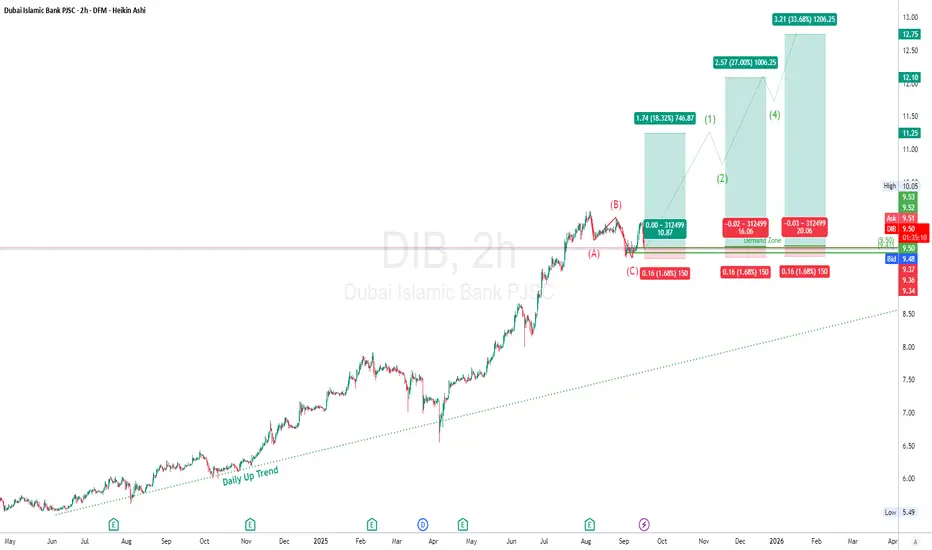
DIB has been in a solid daily uptrend since mid-2024, respecting the rising trendline.
Recently, price completed an ABC corrective structure, pulling back from 12.10 highs → 9.50s.
It is now sitting at the demand zone (9.35–9.50), with signs of buyers stepping back in.
Trend & Structure
Macro Trend: Bullish (higher highs/lows intact).
Current Phase: End of Wave (C) correction.
Next Cycle Projection: Elliott Wave 1–5 up, with 12.75+ targets in sight.
Supply & Demand
Demand Zone (Strong Support): 9.35 – 9.50 (already tested).
Next Resistance Levels (Supply):
11.25
12.10 (previous high)
12.75 (projected Wave 5 target)
Elliott Wave Outlook
Completed: (A)-(B)-(C) correction.
Next: Bullish cycle projected → Wave (1) → (2) → (3) → (4) → (5) toward 12.75.
Measured projections:
Wave (1): 10.87 (+18%)
Wave (3): 12.10 (+27%)
Wave (5): 12.75 (+33%)
💰 Trade Idea
Entry Zone: 9.50 – 9.55 (demand zone bounce).
Stop Loss: 9.35 (below demand).
Take Profit Levels:
TP1: 10.87 (Wave 1)
TP2: 12.10 (Wave 3)
TP3: 12.75 (Wave 5)
🎯 Risk/Reward :
To TP1 = ~1:7
To TP2 = ~1:12
To TP3 = ~1:18+
⚖ Risk Management
Max risk per trade = 1–2% of portfolio.
Move SL to Break-Even (BE) once TP1 is hit.
Scale out 30% at TP1, 30% at TP2, hold rest for TP3.
"In trading, the key is not being right, but having an edge and sticking to it." – Paul Tudor Jones
⚠️ Disclaimer
This is not financial advice. For educational purposes only. Always DYOR before trading.
By Dubai Traders Hub
Follow us on X , YouTube, and Join our Telegram Channel
Follow us on X , YouTube, and Join our Telegram Channel
Disclaimer
The information and publications are not meant to be, and do not constitute, financial, investment, trading, or other types of advice or recommendations supplied or endorsed by TradingView. Read more in the Terms of Use.