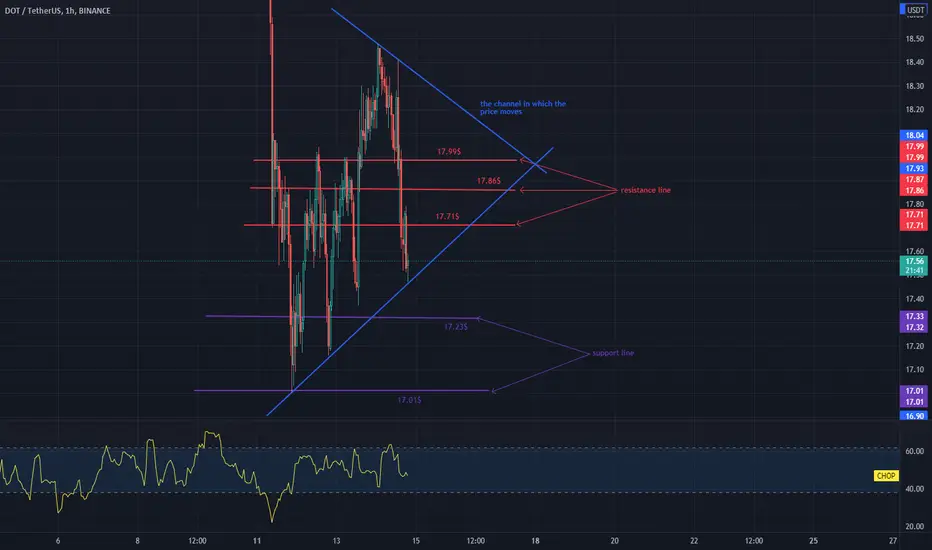
Hello everyone, let's take a look at the 1H DOT to USDT chart. As you can see, the price moves in the designated channel with blue lines.
Please note that this is a short-term analysis.
Let's start with the designation of the support line and as you can see the first support in the near future is $ 17.23, if the support breaks down, the next one is $ 17.01.
Now let's move from the resistance line as you can see the first resistance is $ 17.71, if you can break it the next resistance will be $ 17.86 and $ 17.99.
Looking at the CHOP indicator, we can see that in the 1H interval most of the energy was used.
Disclaimer
The information and publications are not meant to be, and do not constitute, financial, investment, trading, or other types of advice or recommendations supplied or endorsed by TradingView. Read more in the Terms of Use.
Disclaimer
The information and publications are not meant to be, and do not constitute, financial, investment, trading, or other types of advice or recommendations supplied or endorsed by TradingView. Read more in the Terms of Use.