Monthly timeframe
Bias : Bullish
Analysis:
Price has formed a low in September 2025, creating a dealing range with the dealing range high forming in January of 2025. This has set a the dollar index in a relative discount condition warranting a bullish bias. Please do note this bullish bias is mainly enforced by lower timeframes which will be addressed below.
The current bullish draw on liquidity on this timeframe is the monthly bearish fair value gaps at 103.197 to 101.977.
Weekly timeframe
Bias : Bullish
Analysis:
Price has displaced above 99.563 and has closed above the high leaving a bullish weekly fair value gap. This is a key indication that price wants to tread higher and is driving the monthly narrative.
It is expected that price to retrace into this bullish weekly fair value gap within the next 1-2 weeks before heading higher towards the monthly draw on liquidity.
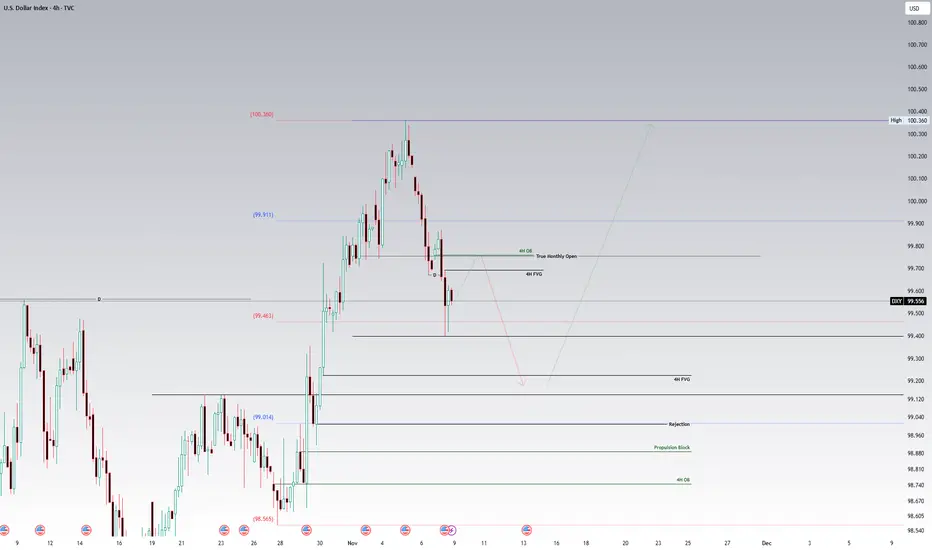
4 hourly timeframe
Bias : Initial bearish with an expectation of bullish reversal to the upside.
Analysis:
This week has seen the dollar index displace below 99.671, leaving a bearish 4H fair value gap. This is an indication that price is still looking to tread lower into further discount before a reversal upside.
Note the 4H bearish order block aligning with the monthly opening price for November 2025. This adds confluence that price would reach for this bearish 4H order block and lower taking out the low of 99.398 heading into the bullish weekly fair value gap.
As mentioned in the 4hourly bias, there is an expectation of bullish reversal. This is where the 4hour timeframe starts to align with the weekly and monthly timeframe.
It is expected that this bullish reversal will occur after price heads into the bullish 4H fair value gap at 99.225. A bullish reversal would be confirmed once there is a bullish market structure shift confirmed with a bullish 4h fair value gap, a bullish 4H balanced price range, or an intermediate term low forming after price reacts off the 4H buyside imbalance sellside inefficiency.
Side notes
- Should this analysis not pan out the next point of interest would be the bullish rejection block and propulsion block on the 4H chart. Should these not hold, the bias may turn bearish.
- This analysis is for educational purposes and should not be taken as financial advice. The financial markets carry significant financial risk.
- For ease of readability, please turn off all indicators in my chart. This can be done by using the Ctrl+Alt+H function. Should you see multiple charts you can view one chart at a time by clicking on the one chart while holding down the Alt button.
Bias : Bullish
Analysis:
Price has formed a low in September 2025, creating a dealing range with the dealing range high forming in January of 2025. This has set a the dollar index in a relative discount condition warranting a bullish bias. Please do note this bullish bias is mainly enforced by lower timeframes which will be addressed below.
The current bullish draw on liquidity on this timeframe is the monthly bearish fair value gaps at 103.197 to 101.977.
Weekly timeframe
Bias : Bullish
Analysis:
Price has displaced above 99.563 and has closed above the high leaving a bullish weekly fair value gap. This is a key indication that price wants to tread higher and is driving the monthly narrative.
It is expected that price to retrace into this bullish weekly fair value gap within the next 1-2 weeks before heading higher towards the monthly draw on liquidity.
4 hourly timeframe
Bias : Initial bearish with an expectation of bullish reversal to the upside.
Analysis:
This week has seen the dollar index displace below 99.671, leaving a bearish 4H fair value gap. This is an indication that price is still looking to tread lower into further discount before a reversal upside.
Note the 4H bearish order block aligning with the monthly opening price for November 2025. This adds confluence that price would reach for this bearish 4H order block and lower taking out the low of 99.398 heading into the bullish weekly fair value gap.
As mentioned in the 4hourly bias, there is an expectation of bullish reversal. This is where the 4hour timeframe starts to align with the weekly and monthly timeframe.
It is expected that this bullish reversal will occur after price heads into the bullish 4H fair value gap at 99.225. A bullish reversal would be confirmed once there is a bullish market structure shift confirmed with a bullish 4h fair value gap, a bullish 4H balanced price range, or an intermediate term low forming after price reacts off the 4H buyside imbalance sellside inefficiency.
Side notes
- Should this analysis not pan out the next point of interest would be the bullish rejection block and propulsion block on the 4H chart. Should these not hold, the bias may turn bearish.
- This analysis is for educational purposes and should not be taken as financial advice. The financial markets carry significant financial risk.
- For ease of readability, please turn off all indicators in my chart. This can be done by using the Ctrl+Alt+H function. Should you see multiple charts you can view one chart at a time by clicking on the one chart while holding down the Alt button.
Disclaimer
The information and publications are not meant to be, and do not constitute, financial, investment, trading, or other types of advice or recommendations supplied or endorsed by TradingView. Read more in the Terms of Use.
Disclaimer
The information and publications are not meant to be, and do not constitute, financial, investment, trading, or other types of advice or recommendations supplied or endorsed by TradingView. Read more in the Terms of Use.