📈 DXY – Long-Term Elliott Wave Analysis (Monthly) –
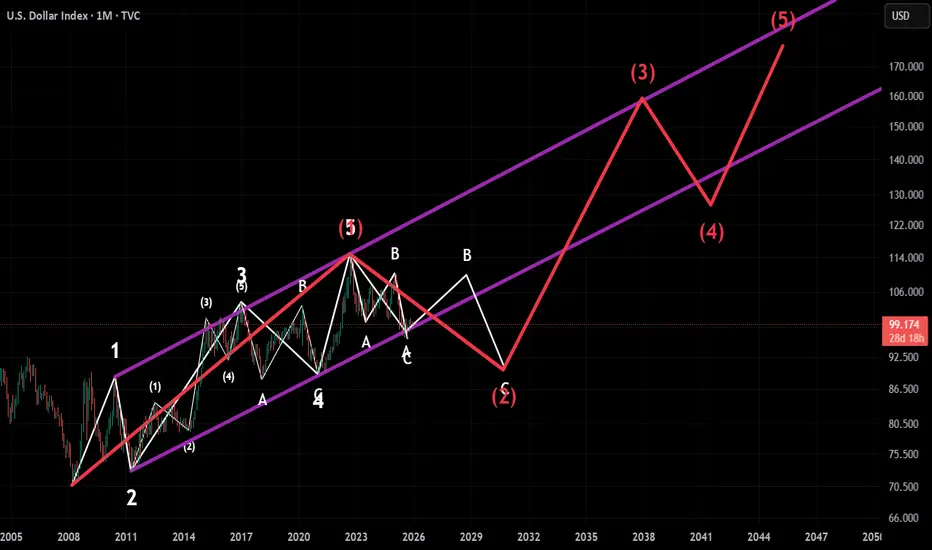
The US Dollar Index continues to follow a clear multi-decade Elliott Wave structure inside a rising purple channel, and the long-term configuration strongly suggests that a major Cycle Wave (1–5) impulse has already completed. The advance began with Wave (1) rising sharply off the long-term base, followed by a deep Wave (2) correction back to channel support. From there, the index entered its strongest bullish phase, producing a powerful Wave (3) rally that pushed price into the upper boundary of the long-term channel. After this expansion, the Dollar consolidated through Wave (4), a prolonged sideways/down correction that held the channel midline, before finally completing the sequence with Wave (5), which tagged the upper channel once more and confirmed a multi-decade cycle top.
Following this Cycle Wave (5) top, DXY transitioned into a large A–B–C corrective structure, forming Cycle Wave (2). The first leg, Wave A, broke the uptrend decisively. The subsequent Wave B rally was corrective and choppy, failing to retest the highs and respecting the underside of the channel midline. The ongoing decline represents Wave C, which structurally aligns with a classic deep retracement. Confluence from the long-term channel, structural levels, and Fibonacci projections places the ideal Wave C low inside the 88–92 zone, highlighted as the red box on the chart. This region corresponds with the 0.5–0.618 retracement of the entire Wave (1–5) advance, making it the most logical area for Cycle Wave (2) to complete.
Momentum also supports a continued corrective bias in the near term. The monthly RSI sits around 44–47, historically consistent with mid-correction conditions rather than a completed low. Previous major cycle bottoms formed closer to RSI 30–35, hinting that further downside pressure may still be required before a durable reversal emerges. Key horizontal levels add confluence: 92.00 serves as the first structural support, while the 88–90 zone marks the primary inflection point for the end of Wave C. Strong resistance overhead rests at 105, followed by 120–122 at the channel midline.
Once Wave C completes and Cycle Wave (2) bottoms, the structure supports the beginning of a massive Cycle Wave (3) advance. This next impulsive sequence has long-term targets at 110–115 initially, then 125–130 as the mid-cycle rally develops, followed by a potential retest of the 135–140 range at the upper channel. The final Cycle Wave (5) of the future structure projects toward 150–155, aligning with the extended upper channel shown on the chart. This represents the super-cycle bullish scenario for the Dollar.
An alternative, lower-probability scenario suggests that Wave B may not have fully completed, allowing additional sideways action before Wave C resumes downward. However, only a sustained break below the long-term lower channel boundary (around 80–82) would invalidate the bullish super-cycle outlook. Until then, the primary expectation remains that DXY is approaching the final stage of its Wave C decline, after which a multi-year uptrend should begin.
Overall, the next 1–3 months appear biased toward downside continuation into the 88–92 support zone to finalize Cycle Wave (2). The subsequent 3–6 months favor the emergence of a strong bullish reversal that begins the early stages of Cycle Wave (3). The long-term chart remains structurally bullish, and once the corrective C-wave completes, the Dollar is positioned for a powerful multi-year advance.
Disclaimer
The information and publications are not meant to be, and do not constitute, financial, investment, trading, or other types of advice or recommendations supplied or endorsed by TradingView. Read more in the Terms of Use.
Disclaimer
The information and publications are not meant to be, and do not constitute, financial, investment, trading, or other types of advice or recommendations supplied or endorsed by TradingView. Read more in the Terms of Use.