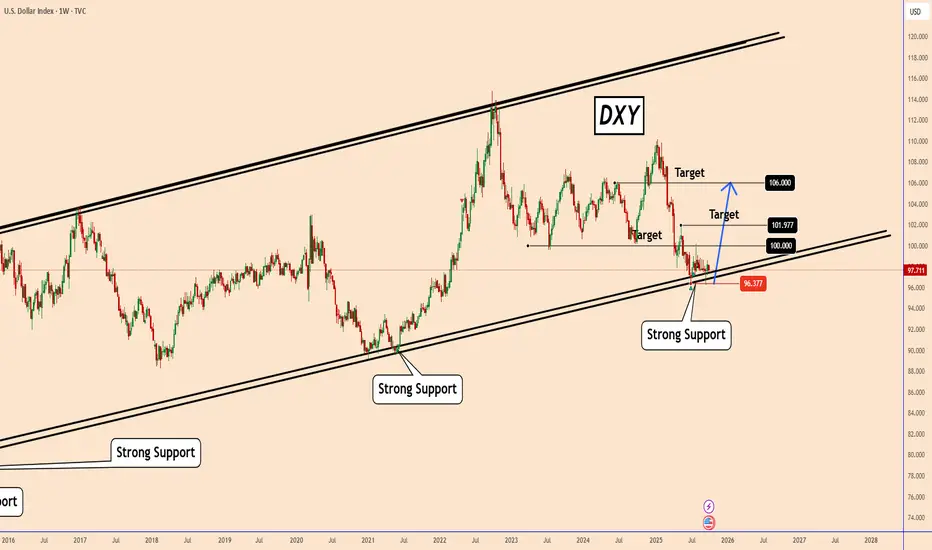
DXY (US Dollar Index): Seen in a Weekly Chart Perspective
The chart shows DXY is sitting on a long-term ascending support line that has held multiple times since 2015. Price recently tested this support again near 96.37, making it a key level.
Price is around 97.70, close to support. This zone is crucial: as long as it holds, the bias remains for a bounce.
🎯 Key Targets:
First target: 100.00 (psychological target)
Second target: 101.97
Third target: 106.00
If DXY breaks and closes below 96.37, it could invalidate the bullish outlook and open space toward 94.00–92.00 levels.
The Dollar Index is at a critical support zone. If buyers defend this area, we could see a rebound toward 100–106. But if support fails, further downside could follow.
You may find more details in the chart!
Thank you and Good Luck!
❤️PS: Please support with a like or comment if you find this analysis useful for your trading day❤️
✅MY FREE Signals Channel
t.me/TradingPuzzles
✅Personal Telegram
t.me/KlejdiCuni
✅Suggested News Channel
t.me/ForexNewsNavigator_Official
t.me/TradingPuzzles
✅Personal Telegram
t.me/KlejdiCuni
✅Suggested News Channel
t.me/ForexNewsNavigator_Official
Disclaimer
The information and publications are not meant to be, and do not constitute, financial, investment, trading, or other types of advice or recommendations supplied or endorsed by TradingView. Read more in the Terms of Use.