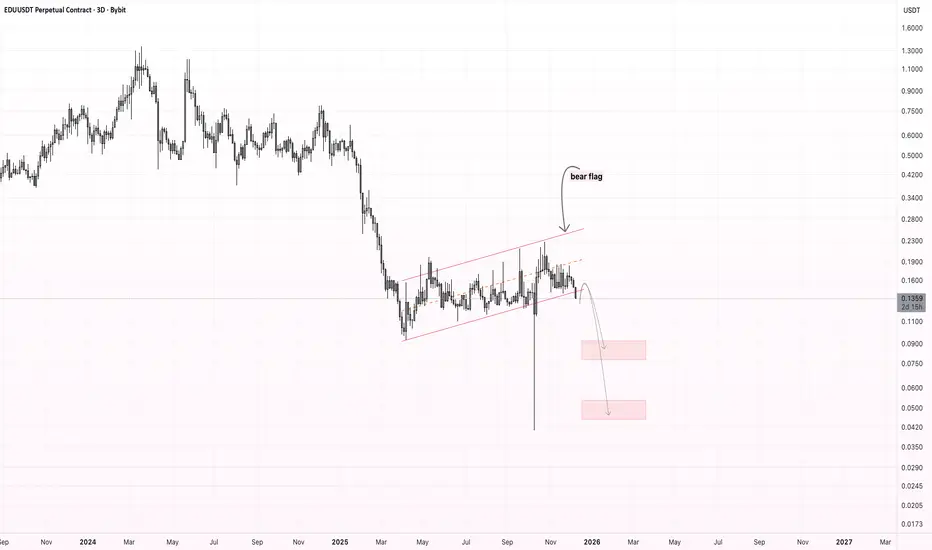
The recent price action on EDUUSDT is forming a clear bear flag on the 3D timeframe. After a strong impulsive drop, the market has been consolidating inside an upward-sloping channel — a classic continuation pattern in a downtrend.
Price is now losing support at the lower boundary of the channel, suggesting the bear flag may be close to confirming a breakdown. If momentum continues to the downside, the next liquidity zones are located significantly lower.
Key observations:
Downside Targets:
$0.09–$0.08
$0.055–$0.045
As long as price remains below the flag resistance, downside continuation remains the dominant scenario.
Price is now losing support at the lower boundary of the channel, suggesting the bear flag may be close to confirming a breakdown. If momentum continues to the downside, the next liquidity zones are located significantly lower.
Key observations:
- Structure aligns with a bear flag, often signaling continuation of the prior sell-off.
- Price is testing the lower trendline of the channel with increasing weakness.
- A confirmed breakdown opens the path toward the next demand zones.
Downside Targets:
$0.09–$0.08
$0.055–$0.045
As long as price remains below the flag resistance, downside continuation remains the dominant scenario.
Disclaimer
The information and publications are not meant to be, and do not constitute, financial, investment, trading, or other types of advice or recommendations supplied or endorsed by TradingView. Read more in the Terms of Use.
Disclaimer
The information and publications are not meant to be, and do not constitute, financial, investment, trading, or other types of advice or recommendations supplied or endorsed by TradingView. Read more in the Terms of Use.