Unveiling the
Price Action Description
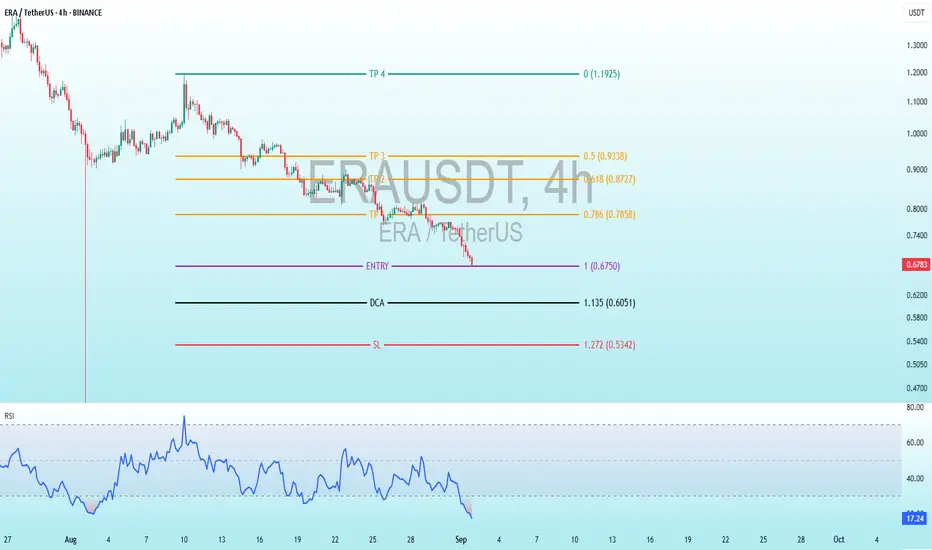
Historical Trend: The price began around 1.20 USDT in late July, with initial choppy movement. A sharp decline in early August dropped it to 0.50-0.60 USDT, followed by a brief recovery to 0.80-1.00 USDT in mid-August. Another steep fall occurred in late August/early September.
Recent Movement: A massive red candlestick around September 1 marks a vertical drop from 1.00-1.10 USDT to 0.60-0.70 USDT, suggesting a capitulation event or flash crash. The price has stabilized around 0.682 USDT as of 11:03 PM CEST, with smaller candles indicating reduced volatility or exhaustion.
Current Price: Approximately 0.682 USDT, down 40-50% from July highs, hinting at potential oversold conditions.
Volatility: High, evident from long wicks and large candle bodies, especially during drops, though volume data is absent.
Key Technical Levels
Entry: Set at 0.6750 USDT, the suggested point to enter a long position, slightly below the current price of 0.682 USDT, anticipating a small pullback before confirming the trade.
TP (Take Profit): Targets are 0.7858 USDT for the first profit take, followed by 0.8727 USDT, 0.9338 USDT, and the highest goal at 1.1925 USDT, offering a range of exit points for potential gains.
DCA: Positioned at 0.6051 USDT, a level to add to the trade if the price drops further, helping to average down the entry cost.
SL (Stop Loss): Placed at 0.5342 USDT, the cutoff to exit the trade if the price falls, limiting losses and protecting the position.
Fibonacci Context: These levels appear derived from a downward Fibonacci extension (e.g., -0.618, -0.786) based on the recent drop from 1.20 to 0.50 USDT, suggesting a potential reversal zone. The setup implies a long trade anticipating a bounce.
Risk-Reward: Risk from 0.6750 to 0.5342 is 0.1408 USDT, with rewards to 0.7858 (0.1108, RR 0.8:1) and up to 1.1925 (0.5175, RR ~3.7:1), indicating a favorable setup if the reversal occurs.
Indicators Analysis
RSI (Relative Strength Index): Current value is 17.87, well below 30, signaling oversold conditions and a potential rebound. The line has trended down sharply with the price drop, showing waning momentum without visible bullish divergence yet. The RSI scale (0-100) marks overbought above 70, irrelevant here.
Potential Trading Implications and Risks
Bullish Case: The marked levels suggest a bottom-fishing opportunity post-crash, supported by oversold RSI. A rebound to take-profit levels is plausible if the broader crypto market stabilizes (e.g., Bitcoin trends) or if positive news emerges for ERA (e.g., gaming ecosystem updates).
Bearish Case: The dominant downtrend and recent sharp drop indicate strong selling pressure. Breaking below 0.6051 (DCA) or 0.5342 (SL) could lead to further declines toward 0.40-0.50 USDT.
Market Context: As of 11:03 PM CEST on September 1, 2025, check for recent events—token unlocks, hacks, or macro factors like interest rate changes affecting risk assets.
Risks: High altcoin volatility, lack of volume data (limiting liquidity insight), and subjective Fib levels. Use risk management (e.g., 1-2% account risk).
Suggestions: Confirm with bullish patterns (e.g., hammer or engulfing) at 0.6750 or RSI crossing above 30.
Trade active
ENTRY 0.6750 TARGET SCALP ✅ +8.43% PROFIT
🏋️♂️ The harder you work for something, the greater you’ll feel when you achieve it.
Interested for Premium 👉 t.me/Altcoin_Piooners
Follow for signals! 🔥#Crypto #Trading #CryptoSignals #ERA #Altcoins
✅MY Free Signals Telegram
t.me/AltcoinPiooners
✅Personal Telegram (Premium)
t.me/Altcoin_Piooners
✅YouTube
youtube.com/@AltcoinPiooners
t.me/AltcoinPiooners
✅Personal Telegram (Premium)
t.me/Altcoin_Piooners
✅YouTube
youtube.com/@AltcoinPiooners
Disclaimer
The information and publications are not meant to be, and do not constitute, financial, investment, trading, or other types of advice or recommendations supplied or endorsed by TradingView. Read more in the Terms of Use.