ES Market Overview (Daily/4H/1H)
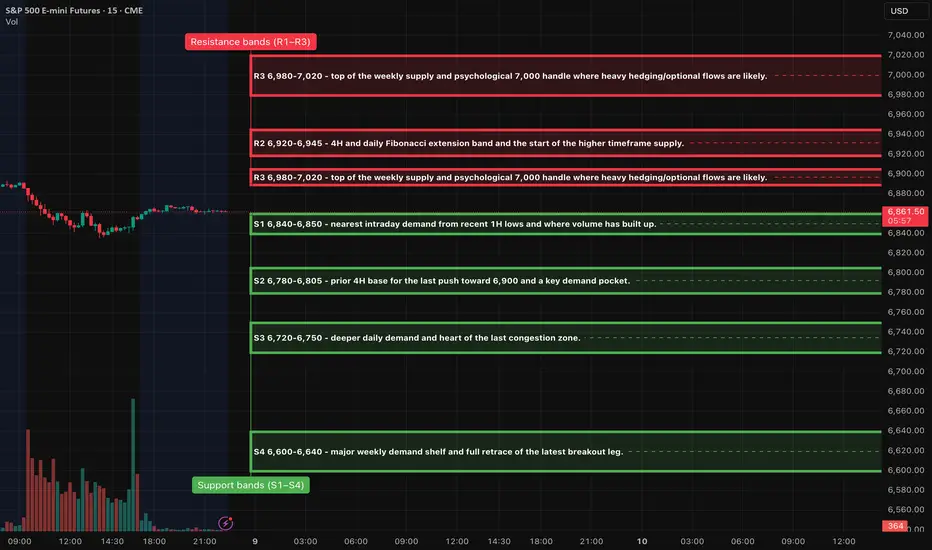
The daily trend in the ES market remains bullish, with prices consistently above the most recent higher low while approaching a significant multi-month supply zone characterized by the 6,980-7,020 range. Although momentum has moderated, it has not completely reversed, suggesting that buyers continue to support dips, while larger market participants exercise caution around the 7,000 mark.
On the 4-hour chart, we have identified a new swing high near 6,900, followed by a notable pullback that touched the 6,820-6,840 area and subsequently rebounded. This development maintains the sequence of higher lows; however, sellers are becoming increasingly active with each attempt to rally towards the 6,880-6,900 range.
Examining the shorter-term 1-hour and 30-minute charts reveals that Monday experienced a lower high compared to last week's peak, leading to a decline towards the 6,820s before regaining ground in the 6,860s. Currently, the ES is positioned midway within the support band and beneath the intraday highs around 6,875-6,895, indicating a balanced short-term outlook: buyers are engaged below the 6,850 level, while selling pressure emerges near 6,890.
Macro Backdrop for Tomorrow
As we approach the December FOMC meeting, which kicks off tomorrow with the decision and subsequent press conference from Fed Chair Jerome Powell expected on Wednesday, market positioning is likely to remain cautious, especially near the upper range.
Key U.S. data releases scheduled for tomorrow include the NFIB Small Business Optimism Index at 6:00 ET for November and the postponed JOLTS job openings report at 10:00 ET for October. These reports provide insights into hiring trends and business sentiment following the autumn slowdown and recent government shutdown. In particular, the 10:00 ET release could trigger increased volatility. Furthermore, the global tone appears somewhat apprehensive, with Asian markets showing signs of weakness ahead of the Fed's decision.
OVERNIGHT SESSION FORECAST FOR NY MARKETS
In the base case scenario, we anticipate that the E-mini S&P 500 (ES) will navigate between support level S1, situated between 6,840 and 6,850, and the band of 6,875 to 6,895 as traders position themselves ahead of the JOLTS report and the commencement of the Federal Reserve meeting. A retreat to S1 that holds above the approximate level of 6,835 is considered constructive, potentially setting the stage for a recovery into the upper range of Monday’s session, specifically around 6,880 to 6,895, as we transition into London trading and early New York.
On the upside, should buyers successfully propel and maintain prices above 6,900 during the New York morning session, the next significant target would be resistance level R2, ranging from 6,920 to 6,945. This area is likely to attract selling activities as market participants position themselves ahead of the Fed's Wednesday decision, making sustained trading above R2 before the announcement less probable.
Conversely, if S1 does not hold and we witness hourly closes below approximately 6,835, this could indicate a shift toward a more bearish outlook, paving the way for a decline towards support level S2, which lies between 6,780 and 6,805—aligning with the 4-hour higher low region. Such a breakdown would frame the next trading day as a corrective phase within the broader uptrend.
Overall, the bias heading into tomorrow leans mildly bullish yet appears to be capped. We expect a two-sided trading range, with initial dips towards S1 likely attracting buying interest, while pronounced selling pressure is anticipated around the 6,890-6,905 region and more so at 6,920-6,945 as traders await further guidance from the Federal Reserve.
A++ Setup 1 - Short from R1
Entry: 6,892 - 6,900 short
SL: 6,912
TP1: 6,850
TP2: 6,815 - 6,820
TP3: 6,790 - 6,800
A++ Setup 2 - Long from S1
Entry: 6,842 - 6,850 long
SL: 6,828
TP1: 6,882 - 6,890
TP2: 6,905
TP3: 6,920 - 6,930
Good Luck !!!
If you want to contact me Email: info@algoindex.com or algoindex.com
Related publications
Disclaimer
The information and publications are not meant to be, and do not constitute, financial, investment, trading, or other types of advice or recommendations supplied or endorsed by TradingView. Read more in the Terms of Use.