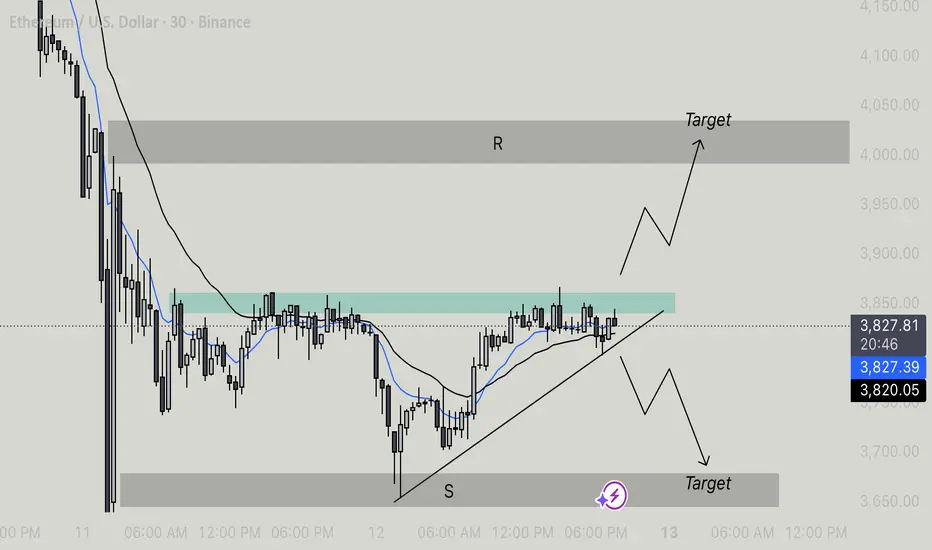
Ethereum is currently trading within an ascending triangle pattern, characterized by a horizontal resistance zone and rising trendline support. This pattern typically signals bullish continuation, though traders should watch closely for confirmation before entering a position.
Key Levels
• Resistance Zone (R): Around $3,850–$3,870, marked by repeated price rejection.
• Support Zone (S): Around $3,700–$3,720, providing strong buying interest.
• Current Price: Approximately $3,839.
Technical Outlook
• Trendline Support: ETH is respecting a clear upward-sloping trendline, showing buyers are steadily pushing higher lows.
• Horizontal Resistance: Price continues to test the $3,850 resistance area. A strong breakout and close above this level would confirm bullish momentum.
• Moving Averages: The shorter-term (blue) EMA is positioned above the longer-term (black) EMA, suggesting near-term bullish bias as long as support holds.
Scenarios
• Bullish Scenario:
If Ethereum breaks and holds above the $3,850 resistance, it could trigger a move toward the next resistance target near $4,000–$4,050. This would confirm a breakout from the ascending triangle pattern.
• Bearish Scenario:
A breakdown below the ascending trendline could lead to a retest of the $3,700 support zone or even lower toward $3,650, signaling short-term weakness.
Summary
Ethereum is consolidating just below a key resistance level within an ascending triangle. A breakout above $3,850 may open the door to further upside momentum, while a breakdown below trendline support could invalidate the bullish setup. Traders should watch for a decisive move with volume confirmation to gauge the next direction.
Disclaimer
The information and publications are not meant to be, and do not constitute, financial, investment, trading, or other types of advice or recommendations supplied or endorsed by TradingView. Read more in the Terms of Use.
Disclaimer
The information and publications are not meant to be, and do not constitute, financial, investment, trading, or other types of advice or recommendations supplied or endorsed by TradingView. Read more in the Terms of Use.
