Hello, traders!
Follow us to get the latest updates quickly.
Have a great day!
-------------------------------------
(BTC.D 1M chart)
For an altcoin bull market to begin, the price must either fall below 55.01 and hold or continue its downward trend.
(USDT.D 1M chart)
I believe that USDT dominance must remain below 4.91 or continue its downward trend for the coin market to continue its upward trend.
The maximum decline in 2025 is expected to be around 2.84-3.42.
After that, the coin market is expected to enter a bear market with an upward trend.
------------------------------------
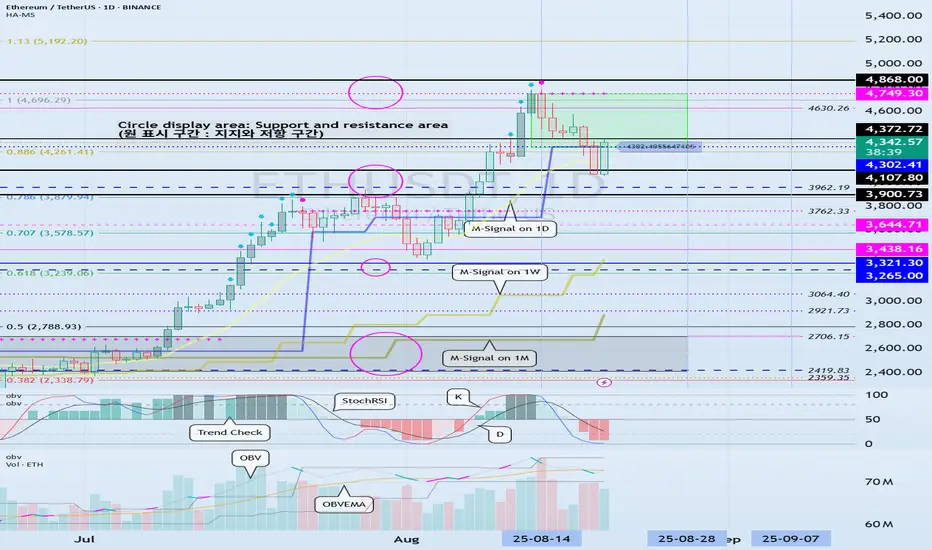
(ETHUSDT 1D chart)
It touched the previous all-time high (ATH) range of 3900.73-4107.80 and is showing an upward trend above 4302.41.
Therefore, we need to check whether it can find support around 4302.41-4372.72.
To continue the step-up trend, it's expected to rise above 4749.30.
-
When a new candlestick is formed, a low trend line is expected to form, consolidating the trend line as shown below.
Therefore, the key question is whether the price can rise along the rising channel after the volatility period around August 28 (August 27-29).
-
The 4302.41-4749.30 range represents a high-boundary zone, requiring a short and quick response when trading.
Therefore, if the price finds support near 4302.41 and rises, it would be wise to develop a trading strategy based on the assumption that the first sell-off will occur around 4749.30.
For the uptrend to continue, rising above 4749.30,
- the StochRSI indicator must remain upward with K > D,
- the OBV must rise above the High Line and remain upward,
- the TC (Trend Check) indicator must remain upward. (Preferably, it should show an upward trend above 0.)
If the above conditions are met, I believe the uptrend is likely to continue.
-
If the price falls below 4302.41,
1st: 3900.73-4107.80
2nd: M-Signal on the 1W chart
We need to check for support near the 1st and 2nd levels above.
-
The basic trading strategy is to buy in the HA-Low ~ DOM (-60) range and sell in the HA-High ~ DOM (60) range.
However, if the price rises from the HA-High to DOM(60) range, it is likely to exhibit a step-like upward trend, while if it falls from the HA-Low to DOM(-60) range, it is likely to exhibit a step-like downward trend.
Therefore, the basic trading strategy should be a segmented trading strategy.
If you purchase a new position because the price appears to be supporting the HA-High to DOM(60) range, you should execute the trade quickly and with short-term responses.
Otherwise, if the price falls below the HA-High indicator, it is likely to decline until it meets the HA-Low or DOM(-60) indicator.
-
Thank you for reading to the end.
I wish you successful trading.
--------------------------------------------------
- This is an explanation of the big picture.
(3-year bull market, 1-year bear market pattern)

I will explain in more detail when the bear market begins.
------------------------------------------------------
Trade active
#ETHUSDTA new all-time high (ATH) has been reached.
Since the price rose within the HA-High ~ DOM (60) range of 4302.41-4749.30, the key question is whether it can find support near 4749.30 and continue its upward trend.
Note
#ETHUSDTThe most important range at the current price level is 3900.73-4107.80.
If the price remains above this range, the uptrend is likely to continue.
If the price falls below the 3900.73-4107.80 range, it is likely to decline until it meets the M-Signal indicator on the 1W chart.
At this point, it is crucial to find support around 3265.0-3321.30.
-
The 4630.26 point corresponds to the previous high on the 1M chart.
Therefore, from a long-term perspective, if the price holds above 4630.26, the uptrend is likely to continue.
Therefore, the key question is whether the price can find support and rise around the 4302.41-4749.30 range, i.e., the HA-High ~ DOM (60) range.
Note
#ETHUSDTAfter setting a new all-time high (ATH), the price is showing a downward trend.
However, I believe the potential downside for this uptrend is a decline below the 3900.73-4107.80 range.
Therefore, if the price holds above the 3900.73-4107.80 range, the uptrend is likely to continue.
If the price falls below 3900.73-4107.80, it is likely to decline until it meets the M-Signal indicator on the 1W chart.
Therefore, support levels around 3900.73-4107.80 are crucial.
If the price holds above 4372.72, I believe it will likely attempt to renew its all-time high (ATH).
The next period of volatility will be around August 28th (August 27th-29th).
Therefore, the key question is whether the price can find support and rise above the 4302.41-4749.30 level after this period of volatility.
- We must recall the basic trading strategy.
The basic trading strategy is to buy in the DOM(-60) ~ HA-Low range and sell in the HA-High ~ DOM(60) range.
However, if it rises in the HA-High ~ DOM(60) range, it is likely to show a step-like upward trend. If it falls in the DOM(-60) ~ HA-Low range, it is likely to show a step-like downward trend.
Therefore, a split trading strategy is essential.
The most important thing in trading is how to stabilize your psychological state.
If your psychological state becomes unstable, you are more likely to suddenly execute an unintended trade.
Therefore, split trading is essential to stabilize your psychological state.
※ Follow X to check out the posts.
※ X를 팔로우하고 게시물을 확인하세요.
◆ t.me/readCryptoChannel
[HA-MS Indicator]
bit.ly/3YxHgvN
[OBV Indicator]
bit.ly/4dcyny3
※ X를 팔로우하고 게시물을 확인하세요.
◆ t.me/readCryptoChannel
[HA-MS Indicator]
bit.ly/3YxHgvN
[OBV Indicator]
bit.ly/4dcyny3
Related publications
Disclaimer
The information and publications are not meant to be, and do not constitute, financial, investment, trading, or other types of advice or recommendations supplied or endorsed by TradingView. Read more in the Terms of Use.