Hello, traders!
Follow us to get the latest information quickly.
Have a great day!
-------------------------------------
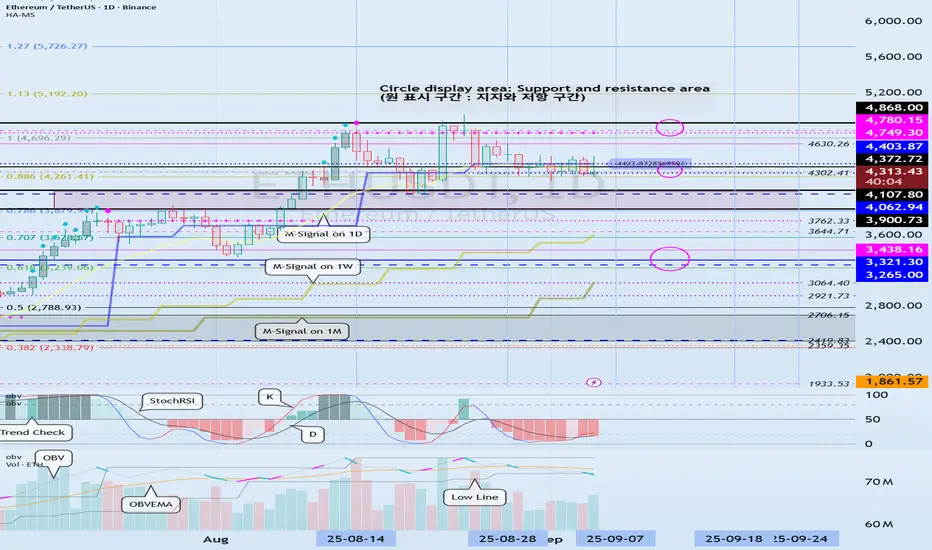
(ETHUSDT 1D Chart)
This volatility period is around September 7th (September 6th-10th).
After this period of volatility, the key question is whether the price can find support and rise above the 4403.87-4749.30 level.
-
To continue the cascading upward trend, the price must rise above 4749.30.
Therefore, we need to monitor whether the price maintains above the 4749.30-4868.0 level.
-
If resistance is encountered at 4403.87 and the price declines, it is likely to decline until it meets the HA-Low indicator.
Therefore, we need to check for support around 4302.41-4403.87.
However, there is a possibility of a rise after touching the previous all-time high (ATH) range of 3900.73-4107.80, so we need to consider a response plan.
If the price falls below 4107.80, it is expected to touch the M-Signal indicator on the 1W chart and resume the trend.
-------------------------------
The On-By-Signal (OBV) indicator is falling below the Low Line.
The TC (Trend Check) indicator is below 0.
The K value of the StochRSI indicator is showing signs of rising from the oversold zone.
If the High Line of the OBV indicator falls and forms a downward channel, it is highly likely that selling pressure will continue to dominate, so caution is advised when trading.
Therefore, the key issue this time is whether support is found around 4302.41-4403.87.
The TC (Trend Check) indicator is a comprehensive evaluation of the StochRSI, On-By-Signal (OBV), and PVT-MACD Oscillator indicators.
Therefore, if the TC indicator is below 0, selling pressure is dominant, and the price is likely to decline.
If the K value of the StochRSI indicator continues to rise, the price is likely to rise after this period of volatility.
However, for the uptrend to continue, the OBV and TC indicators must show upward trends.
-
Thank you for reading to the end.
We wish you successful trading.
--------------------------------------------------
- Here's an explanation of the big picture.
(3-year bull market, 1-year bear market pattern)

I'll explain more in detail when the bear market begins.
------------------------------------------------------
Trade active
#ETHUSDTBased on the previous movement, this move is likely to follow suit.
To break out of the previous movement, the price must rise above 4780.15 and hold.
If not, we need to see if it finds support near 4062.94.
The current price movement has moved the HA-High ~ DOM(60) range to the 4062.94-4780.15 range.
Based on a basic trading strategy, the HA-High ~ DOM(60) range is considered a sell zone.
※ Follow X to check out the posts.
※ X를 팔로우하고 게시물을 확인하세요.
◆ t.me/readCryptoChannel
[HA-MS Indicator]
bit.ly/3YxHgvN
[OBV Indicator]
bit.ly/4dcyny3
※ X를 팔로우하고 게시물을 확인하세요.
◆ t.me/readCryptoChannel
[HA-MS Indicator]
bit.ly/3YxHgvN
[OBV Indicator]
bit.ly/4dcyny3
Related publications
Disclaimer
The information and publications are not meant to be, and do not constitute, financial, investment, trading, or other types of advice or recommendations supplied or endorsed by TradingView. Read more in the Terms of Use.