EUR/JPY Technical Analysis
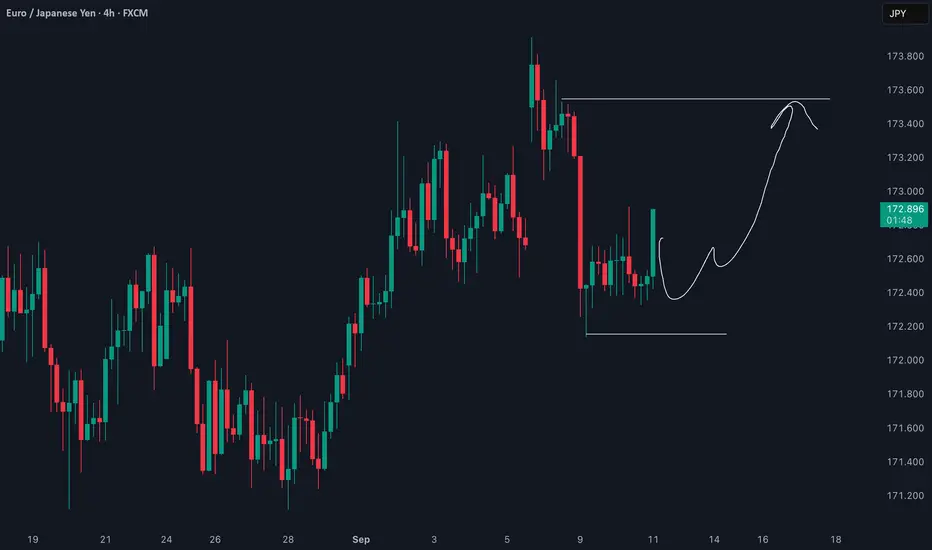
What we're looking at on this 4-hour chart is a classic example of a bullish trend undergoing a healthy correction and potentially preparing for its next move higher. The market is giving us some very clear clues. 🧐
1. Market Structure & Dominant Trend 📈
Overall Trend: The dominant, overarching trend is clearly bullish. Looking at the price action from late August through early September, the market has been consistently printing higher highs and higher lows. This is the primary context, and we generally want to trade in the direction of the main trend.
Corrective Phase: After reaching a peak around $173.80, the price experienced a sharp and aggressive sell-off. This is a typical corrective move or profit-taking phase after a strong impulse leg up.
Consolidation / Accumulation: Price has now stopped falling and is moving sideways, contained within a well-defined range. This is often a sign of accumulation, where buyers are absorbing selling pressure and building positions for a potential move higher.
2. Key Levels to Watch 🎯
Resistance 🛡️: The upper boundary of the current range is at approximately $173.55 - $173.60. This is the immediate ceiling that buyers need to break through to confirm a continuation of the uptrend. It's the "line in the sand" for the bears.
Support: The lower boundary is clearly defined around $172.15 - $172.20. This level has been tested and has held firm, showing that buyers are stepping in to defend this price. As long as we stay above this level, the bullish case remains intact.
Potential Double Bottom / Inverse Head & Shoulders: The price action within the consolidation range is carving out what looks like a Double Bottom or a potential Inverse Head and Shoulders pattern.
Bullish Intention: These are classic bullish reversal/continuation patterns. They signal that the downward momentum of the correction has been exhausted and that buyers are regaining control. The recent strong green candles moving away from the support zone reinforce this buying pressure.
4. Potential Scenarios 🚀 vs. 📉
Bullish Scenario (High Probability): This aligns with your projection. The price continues to respect the support level, completes the right side of the pattern, and breaks through the minor resistance within the range (around $173.00). A confirmed break and close above this level would likely propel the price towards the main resistance at $173.55. A break of that level would signal a full continuation of the bullish trend, with sights on new highs.
Bearish Scenario (Lower Probability): We must always consider the alternative. If buyers fail to push the price higher and we see a strong, decisive 4-hour candle close below the support at $172.15, the bullish setup would be invalidated. This would suggest that the correction is not over and could lead to a deeper move down towards the next major structural support levels.
This is a potential setup that favors the buyers. Patience and risk management are key.
Trade closed: target reached
🚀💰Winning SIGNALS & Trade Copy
Forex 🔗 youtu.be/NBOqnuLT-SI
GOLD 🔗 youtu.be/gXIEt38bcZE
🔥💰 PASS YOUR PROP CHALLENGE FX SIGNALS
🔗 youtu.be/OrtnnrLizeQ
✅ Join Our Free DISCORD
🔗 discord.com/invite/PcBeCdwVQq
Forex 🔗 youtu.be/NBOqnuLT-SI
GOLD 🔗 youtu.be/gXIEt38bcZE
🔥💰 PASS YOUR PROP CHALLENGE FX SIGNALS
🔗 youtu.be/OrtnnrLizeQ
✅ Join Our Free DISCORD
🔗 discord.com/invite/PcBeCdwVQq
Disclaimer
The information and publications are not meant to be, and do not constitute, financial, investment, trading, or other types of advice or recommendations supplied or endorsed by TradingView. Read more in the Terms of Use.