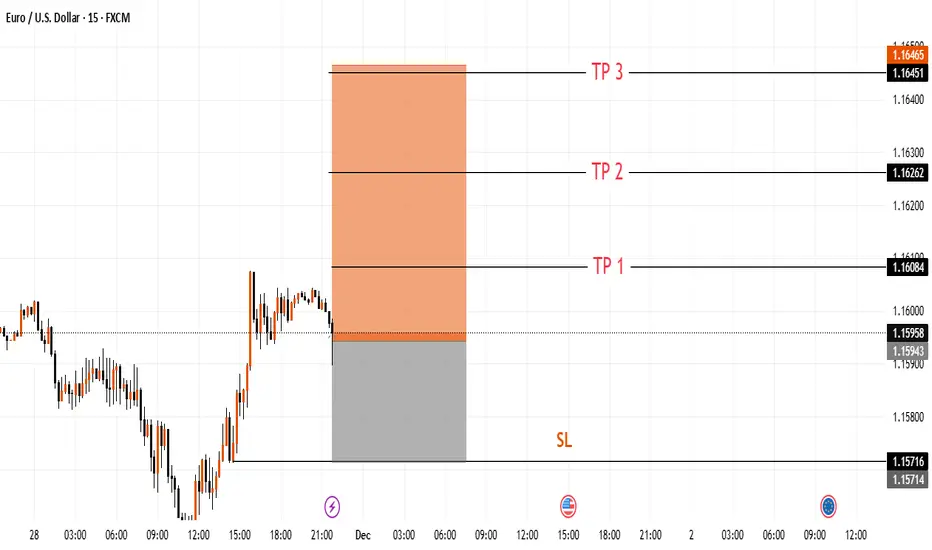
The chart highlights a zone where price recently reacted, with three reference levels drawn above the current area and one lower boundary marked below. This layout helps visualize how price is moving inside the short-term structure and how it has interacted with nearby levels during the session.
Trade active
any updateTrade closed: target reached
any updateDisclaimer
The information and publications are not meant to be, and do not constitute, financial, investment, trading, or other types of advice or recommendations supplied or endorsed by TradingView. Read more in the Terms of Use.
Disclaimer
The information and publications are not meant to be, and do not constitute, financial, investment, trading, or other types of advice or recommendations supplied or endorsed by TradingView. Read more in the Terms of Use.