Price Action & Commentary
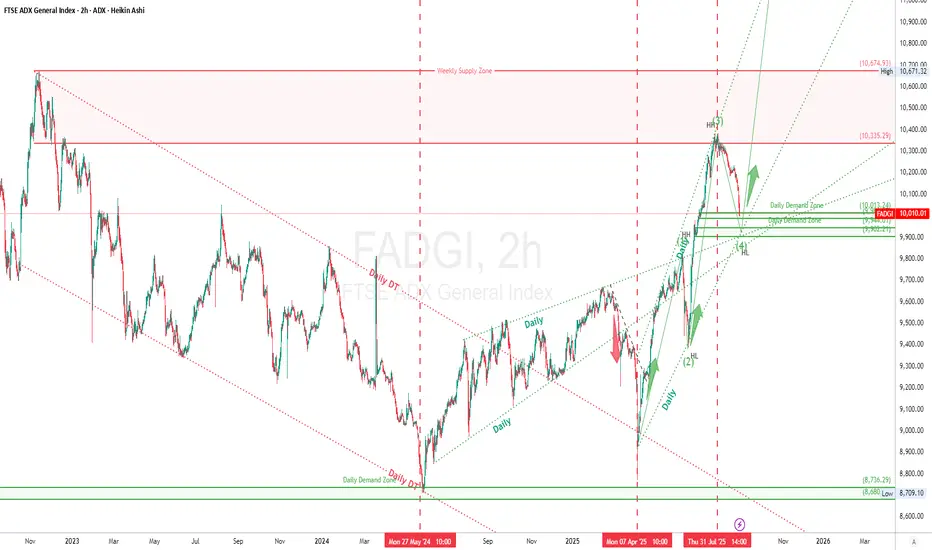
The ADX General index (FTSE ADX ) completed a massive bullish leg from April 2025, breaking out of a multi-year descending channel and shifting into a bullish structure with higher highs and higher lows (HH/HL).
After printing a potential Wave 3 top at ~10,376, price sharply reversed with a clear correction pattern, likely completing Elliott Wave 4 correction.
Price has now entered into a key Daily Demand Zone (~9,96 - 10.013), if the zone holds and impulsive wave 5 should follows.
Another deeper RBR demand zone can be spotted (9,902-9,944) which might act as a reversal zone if the upper zone didn't hold.
Elliott Waves
Wave (1): Initial impulse post descending breakout.
Wave (2): Pullback/retest of broken structure.
Wave (3): Strong rally into new highs (ending near 10,380).
Wave (4): Ongoing correction, likely near completion within the current Daily Demand Zone or the deeper one.
Wave (5): Expected next — if the zone holds and impulse follows, targeting new highs above 10,380 (July 31st high) or 10,700 (Nov 2022 high), or even 11,145 (Max extension of wave 5).
Supply & Demand Zones
🔴 Weekly Supply Zone: 10,335 – 10,674 (Strong selling origin)
🟢 Daily Demand Zone (current focus): 9,922 – 9,985 (price reacting here)
🟢 Deep Demand Zone (historical): 8,709 – 8,736 (last-resort support)
RSI Divergence
RSI is extremely oversold with a Bullish RSI divergence developing on lower timeframes.
⚠️ Disclaimer
This is not financial advice. All trading involves risk. Perform your own analysis or consult a financial advisor before making decisions.
🏷️ Tags
#FADGI #ADX #SwingTrade #SupplyDemand #ElliottWave #HeikinAshi #RSI #RiskManagement #TradingView#DubaiTradersHub
By Dubai Traders Hub
Follow us on X , YouTube, and Join our Telegram Channel
Follow us on X , YouTube, and Join our Telegram Channel
Disclaimer
The information and publications are not meant to be, and do not constitute, financial, investment, trading, or other types of advice or recommendations supplied or endorsed by TradingView. Read more in the Terms of Use.