📊 Technical Analysis Overview:
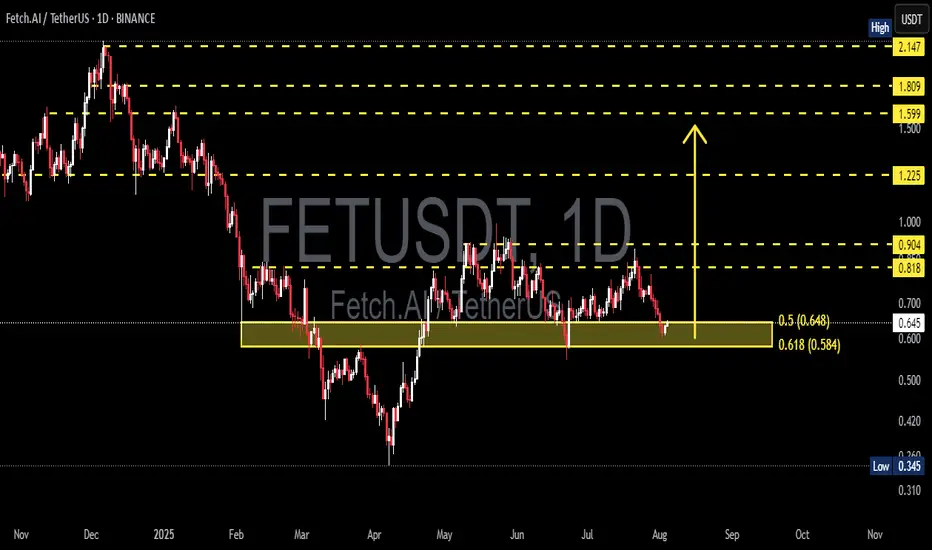
FET/USDT is currently testing a strong demand zone aligned with the Fibonacci Retracement 0.5 – 0.618 levels, specifically between $0.648 and $0.584. This “golden pocket” area is historically significant and often acts as a pivot zone for price reversals.
🔍 Chart Pattern:
The price formed a series of higher highs and higher lows from March to June, indicating a bullish structure.
Since July, momentum has weakened, and the price has corrected back into the key support zone that previously acted as a base for a rally.
---
📈 Bullish Scenario:
If price holds above $0.584 and forms a reversal candlestick (e.g., bullish engulfing or hammer), a strong rebound is likely.
Key upside targets:
$0.818 (minor resistance)
$0.904 (psychological level)
Potential breakout toward $1.225 if bullish volume returns.
📉 Bearish Scenario:
A decisive breakdown below $0.584 with high volume could trigger further downside toward:
$0.42 – $0.345 (next major support zone)
This move could confirm a bearish continuation pattern such as a descending triangle if resistance continues to hold.
---
🎯 Strategic Outlook:
The current zone is a make-or-break level, and the market is at a decision point. Traders should wait for a clear confirmation through price action and volume before committing to directional trades.
#FETUSDT #CryptoAnalysis #FibonacciSupport #AltcoinSetup #FetchAI #TechnicalOutlook #BullishOrBearish #SupportZone #GoldenPocket
✅ Get Free Signals! Join Our Telegram Channel Here: t.me/TheCryptoNuclear
✅ Twitter: twitter.com/crypto_nuclear
✅ Join Bybit : partner.bybit.com/b/nuclearvip
✅ Benefits : Lifetime Trading Fee Discount -50%
✅ Twitter: twitter.com/crypto_nuclear
✅ Join Bybit : partner.bybit.com/b/nuclearvip
✅ Benefits : Lifetime Trading Fee Discount -50%
Disclaimer
The information and publications are not meant to be, and do not constitute, financial, investment, trading, or other types of advice or recommendations supplied or endorsed by TradingView. Read more in the Terms of Use.