Navigating the $FTX Token Recovery: A 4-Hour Chart Insight
Price Action Description
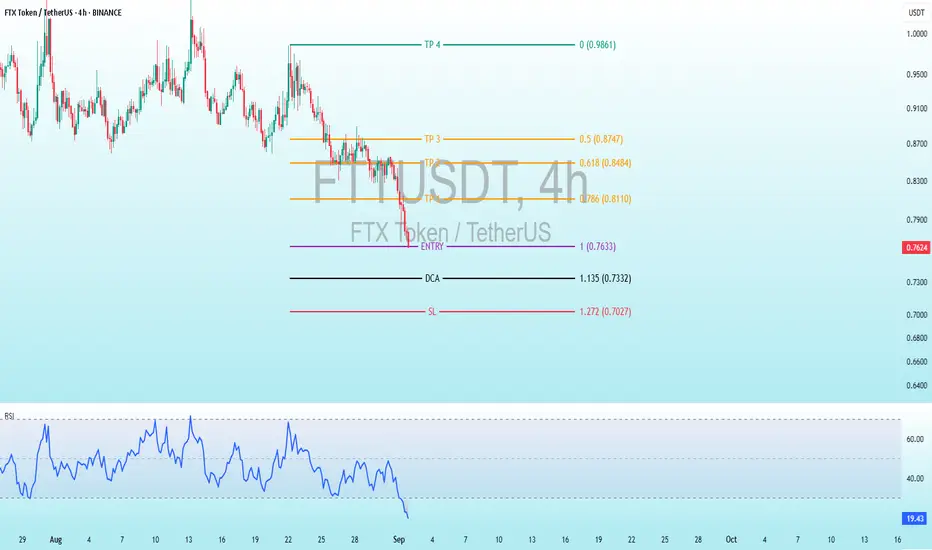
Historical Trend: The price began around 0.09-0.10 USDT in late August, with a choppy uptrend reaching near 0.11 USDT in early September. A sharp decline followed, dropping to the current level of 0.7653 USDT, indicating a significant correction.
Recent Movement: A prominent red candlestick around September 1 marks a drop from approximately 0.10-0.11 USDT to 0.7653 USDT, suggesting strong selling pressure or a market reaction. The price has stabilized near this low, with smaller candles hinting at consolidation.
Current Price: Approximately 0.7653 USDT, down about 20-30% from recent highs, suggesting potential oversold conditions.
Volatility: High, as evident from the long wicks and large candle bodies during the recent drop, though volume data is not visible.
Key Technical Levels
Entry: Set at 0.7633 USDT, the suggested point to enter a long position, very close to the current price of 0.7653 USDT, indicating an immediate buy opportunity with minimal pullback expected.
TP (Take Profit): Targets are 0.0874 USDT for the first profit take, followed by 0.8484 USDT, 0.8110 USDT, and the highest goal at 0.9810 USDT, providing a range of exit points for potential gains.
DCA: Positioned at 0.7332 USDT, a level to add to the trade if the price dips slightly, helping to average down the entry cost.
SL (Stop Loss): Placed at 0.7072 USDT, the cutoff to exit the trade if the price falls, limiting losses and protecting the position.
Fibonacci Context: These levels likely derive from a Fibonacci retracement or extension tool applied to the recent drop from 0.11 USDT to 0.7653 USDT, suggesting a potential reversal zone for a long setup.
Risk-Reward: Risk from 0.7633 to 0.7072 is 0.0561 USDT, with rewards to 0.8110 (0.0477, RR 0.85:1) and up to 0.9810 (0.2177, RR ~3.88:1), indicating a decent setup if the bounce occurs.
Indicators Analysis
RSI (Relative Strength Index): Current value is 19.94, below 30, signaling oversold conditions and a potential rebound. The line has trended downward sharply with the recent drop, showing momentum weakening, but no clear bullish divergence yet. The RSI scale (0-100) marks overbought above 70, not relevant here.
Potential Trading Implications and Risks
Bullish Case: The setup suggests a bottom-fishing opportunity post-drop, supported by oversold RSI. A rebound to take-profit levels is plausible if the broader crypto market stabilizes or if sentiment around FTX Token improves (e.g., legal or exchange-related developments).
Bearish Case: The recent sharp decline and lack of immediate recovery indicate ongoing selling pressure. Breaking below 0.7072 (SL) could lead to further declines toward 0.70 USDT or lower.
Risks: High volatility due to FTT’s history, lack of volume data (limiting liquidity insight), and subjective Fib levels. Use risk management (e.g., 1-2% account risk).
Suggestions: Confirm with bullish patterns (e.g., hammer) at 0.7633 or RSI crossing above 30.
Trade active
ENTRY 0.7633 TARGET SCALP ✅ +6.31% PROFIT
🔄 A loss today is a setup for a win tomorrow.
Interested for Premium 👉 t.me/Altcoin_Piooners
Follow for signals! 🔥#Crypto #Trading #CryptoSignals #FTT #Altcoins
Trade closed: target reached
ENTRY 0.7633 ALL TP ✅ +59.56% PROFIT
📖 Profit or loss, every trade builds your story.
Interested for Premium 👉 t.me/Altcoin_Piooners
Follow for signals! 🔥#Crypto #Trading #CryptoSignals #FTT #Altcoins
✅MY Free Signals Telegram
t.me/AltcoinPiooners
✅Personal Telegram (Premium)
t.me/Altcoin_Piooners
✅YouTube
youtube.com/@AltcoinPiooners
t.me/AltcoinPiooners
✅Personal Telegram (Premium)
t.me/Altcoin_Piooners
✅YouTube
youtube.com/@AltcoinPiooners
Disclaimer
The information and publications are not meant to be, and do not constitute, financial, investment, trading, or other types of advice or recommendations supplied or endorsed by TradingView. Read more in the Terms of Use.